The Progress to Global Target and Progress to Project Target dashboard tiles display icons for your choice of indicators to show how well you're doing against your targets.

Note: The Progress to Project Target tile is available to partners. The Progress to Global Target tile is not.
Progress to Global Target Tile
Configure your tile by clicking on the gear in the tile's top left corner. (You can only configure a tile on your own dashboard, not one that's shared with you.)
In the indicators section, choose the indicators to include in the tile.
In the display section, first choose the reporting period(s) you'd like to use.
- The Last closed option will show for each indicator the last closed reporting period, based on the most recent reporting period end date, that has targets. In the example above you can see that different indicators have different "last closed" reporting periods. This tile will update over time to always use the last closed reporting periods, not the ones shown when you create the tile.
- The Current/Upcoming option is similar, but uses the reporting periods with the nearest end dates in the future.
- Choosing a Fixed reporting period will use a single reporting period for all indicators. Because only one reporting period can be selected, indicators in the tile should belong to the same reporting cycle (e.g. quarterly, annual, etc.).
- Choose to display the data for either just one reporting period (incremental) or all data up to that point (cumulative).
- Finally, choose how the indicator should be labeled.

The parameters for this tile are defined in each indicator's Targets & Data tab. (Program Info > Indicators > select indicator).
- Set the Progress Interpretation as either "higher is better" (e.g. # people trained) or "lower is better" (e.g. # people infected).
- Define the Success Ranges that show a progress icon for Good (green), Warning (yellow), or Bad (red).
- A grey square appears on the tile if there are no targets for that reporting period.

By default, indicators are defined as higher is better, with good as 100% or more and bad as under 100%, but you can add a warning and set each to whatever you'd like.
In this example, good is 90% or up, warning is 80-90%, and bad is under 80%.

In this example, lower values are better (e.g. # people infected). Good is 100% of the target or less, warning is 100-120%, and bad is over 120%.

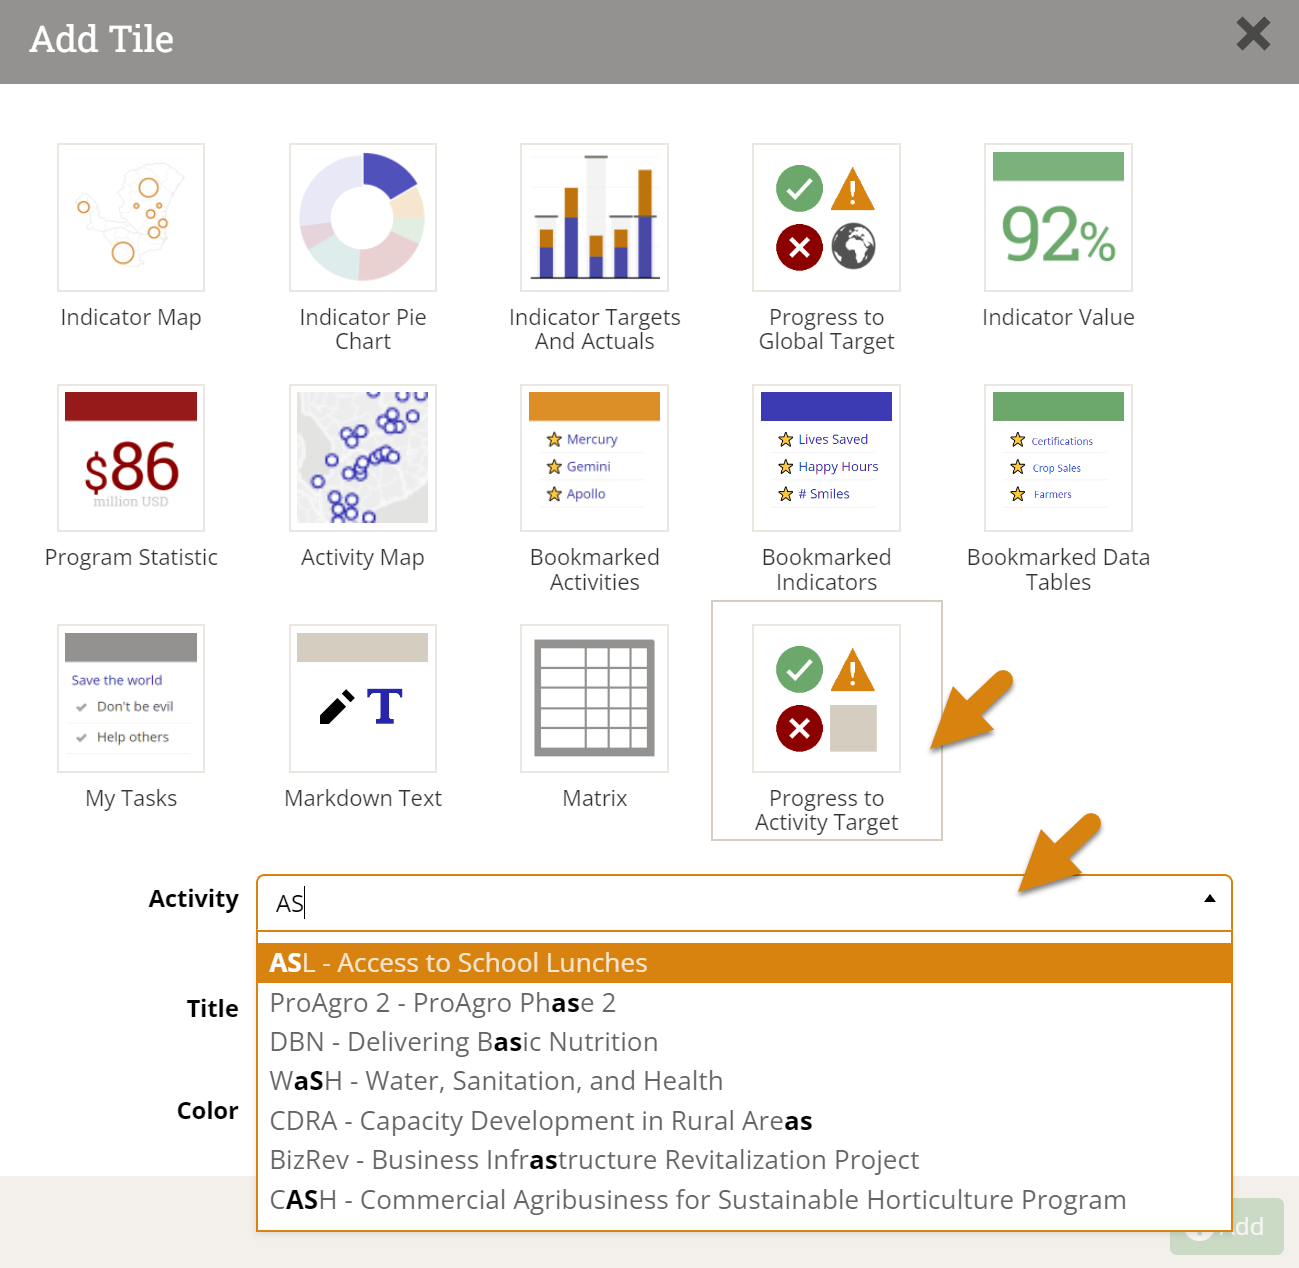
Progress to Project Target Tile
Didn't answer your question? Please email us at help@devresults.com.