This article provides a deep dive into the Count Unique Sets option for a data table indicator. Before exploring this article, make sure you're familiar with the basics for count unique sets.
Below, we'll walk through a few count unique sets examples to demonstrate the various ways they can be used.
- How Do 'Count Unique Sets' Indicators Work?
- Count Types:
- Adding Disaggregations
- Adding Filters
- Frequently Asked Questions
For information on how to map indicators to data tables, see Data Source: Populate from a Data Table. You can also follow the instructions on how to configure Count Unique Sets on that same page.
Quick Tips for Count Unique Sets
- Count Unique Column(s):
- If you don't include a Geography Column in the Count Unique Columns(s) list, the indicator's results are assigned to the largest geography in the system, such as the whole country or the whole world.
- If the indicator is Reported per Project, then you must include a project column in the Count Unique Columns(s) list.
- Count Type:
- Count First and Deduplicate Across Dates both provide an all-time deduplicated count. Count First reports each unique set the first time it appears, while Deduplicate Across Dates lumps the count into the most recent reporting period for the dataset.
- Count Unique Per Date and Count Unique Per Reporting Period do not provide an all-time deduplicated account. These deduplicate your dataset if there are repeats on the same date or repeats within a reporting period (respectively), but these options include duplicates over time.
- Count First and Deduplicate Across Dates both provide an all-time deduplicated count. Count First reports each unique set the first time it appears, while Deduplicate Across Dates lumps the count into the most recent reporting period for the dataset.
- Disaggregations: You can still add disaggregations as usual. Keep in mind that adding a disaggregation to your indicator could change the total for your indicator. (e.g. If you disaggregate by training topic and someone were trained in multiple topics, that person would be counted multiple times, once for each topic.)
- Filters: You can still add filters as usual so that the indicator calculation ignores any rows of data that do not meet the filter criteria.
How Do 'Count Unique Sets' Indicators Work?
Count Unique Sets is a tool for avoiding duplicate counts of things. Imagine an indicator like number of trainees. If you train someone twice, do you want to count them twice? Maybe you never want to count someone twice. Maybe you only want to count someone again if they were trained again in a different reporting period, or on a different topic. Maybe you have a record of all the organizations or farmers or policymakers you've worked with each reporting period, but you want to know just how many you've ever worked with. Count Unique Sets solves this problem.
How does it work? You get to define the set of columns where rows of data that match one other exactly in those columns are only counted one time. As a simple example, if you have a data table populated with training records and a count unique indicator set up to look for unique First Name + Last Name combinations, and you train the same person multiple times, those records will be deduplicated so that they will only be counted once.
The question of what counts as a unique record and when to record a deduplicated result make the logic of count unique indicators more complex. In order to grasp these concepts, it may help to step through a practical example.
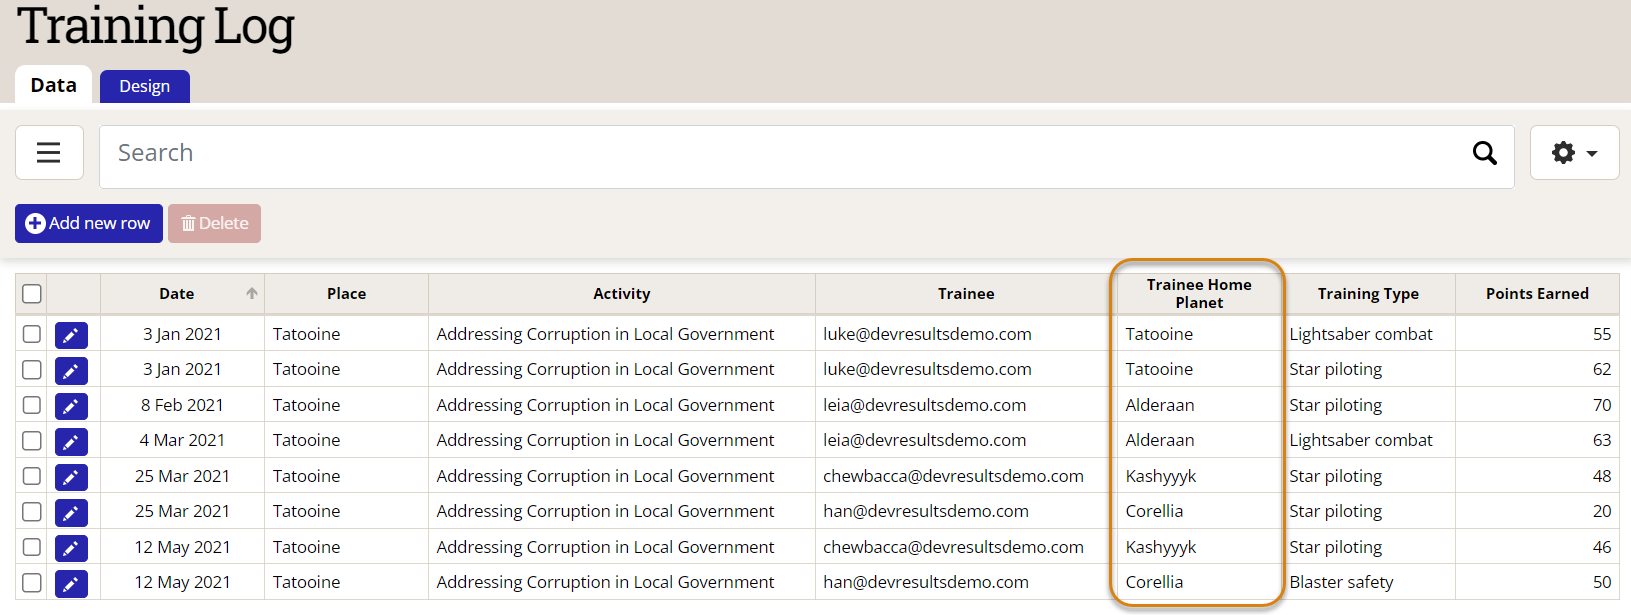
Have a look at the training log below. Four beloved Star Wars characters — Luke, Leia, Han, and Chewbacca — took various training courses on Tatooine provided by the Addressing Corruption in Local Government project. Look carefully at each record, especially the Date and Trainee columns; note that Luke took two different courses, both on the same day in FY2021 Q2 (Jan-Mar), Leia took two different courses on different days both in Q2, and Han and Chewie took a course each in Q2 and Q3. All the characters took star piloting (Chewbacca repeated it actually), the two Force-sensitive characters took lightsaber combat, and Han had to take a remedial course in blaster safety.
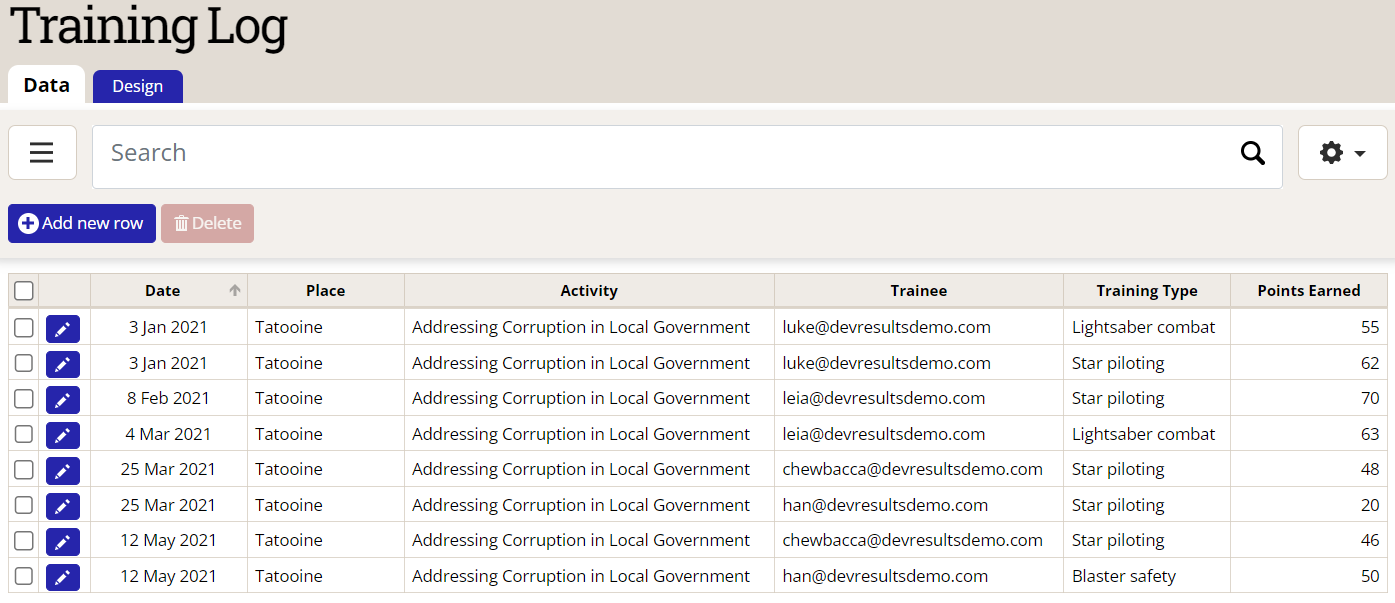
Creating a Count All indicator would simply count complete rows of data (date + geography + project + disaggregation(s) columns, depending on the indicator definition). That may be sufficient for a simple table (here the total would be 8 — 6 in Q2 and 2 in Q3), but in the real world, Count Unique Sets would be more appropriate to ensure that double counting does not occur.
Before we look at the various Count Types that DevResults uses to deduplicate data, take a moment to consider how you would deduplicate the table above, and what counts as a unique record for your purposes?
Count Type: 'Count First'
Count First deduplicates sets across all time, dates, and reporting periods. The overall total for the indicator is the same as for Deduplicate Across Dates. The main difference is that if your table contains rows that match one another in the "count unique columns" you've defined, but the rows have different dates, then the unique "set" will only be counted for the first date it appears in your data table.
This may be the first time a training participant attended a training, the first time a patient entered a clinic, the first time a grantee applied for funding, etc. All subsequent interactions or observations that match the criteria of the original — as defined by the Count Unique Columns list — will effectively be ignored.
In our Star Wars example, this means that we will only count each character once, in the reporting period when they attended their first training session. (Before you proceed, try to determine on your own from the Training Log above what the FY2021 Q2, Q3, and combined total will be for the indicator "# new unique individuals trained.")
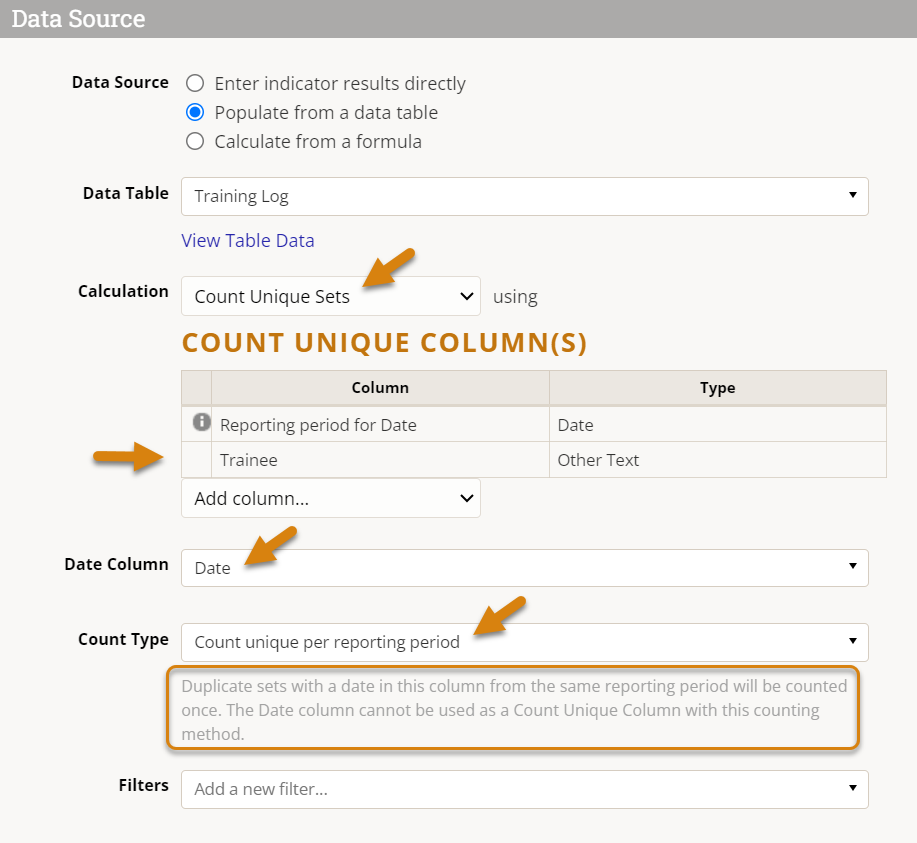
To define a Count First indicator, you will need to do the following:
- Select Count Unique Sets as the calculation method.
- Add the Trainee (name/email) column to the Count Unique Column list, as the unique ID we are using to distinguish one trainee from another.
- Select the Date field in the Date Column dropdown, which will be used to determine which reporting period to record the data in (this may already be selected for you if only one date type field exists).
- Select the Count First option from the Count Type dropdown (note that a brief explanation of how this Count Type works will be provided below).
- Note that if you switch from one Count Type to another, the selected Date Column will be removed from the Count Unique Column list when you switch the Count Type to Count First as it cannot be used with this counting method.
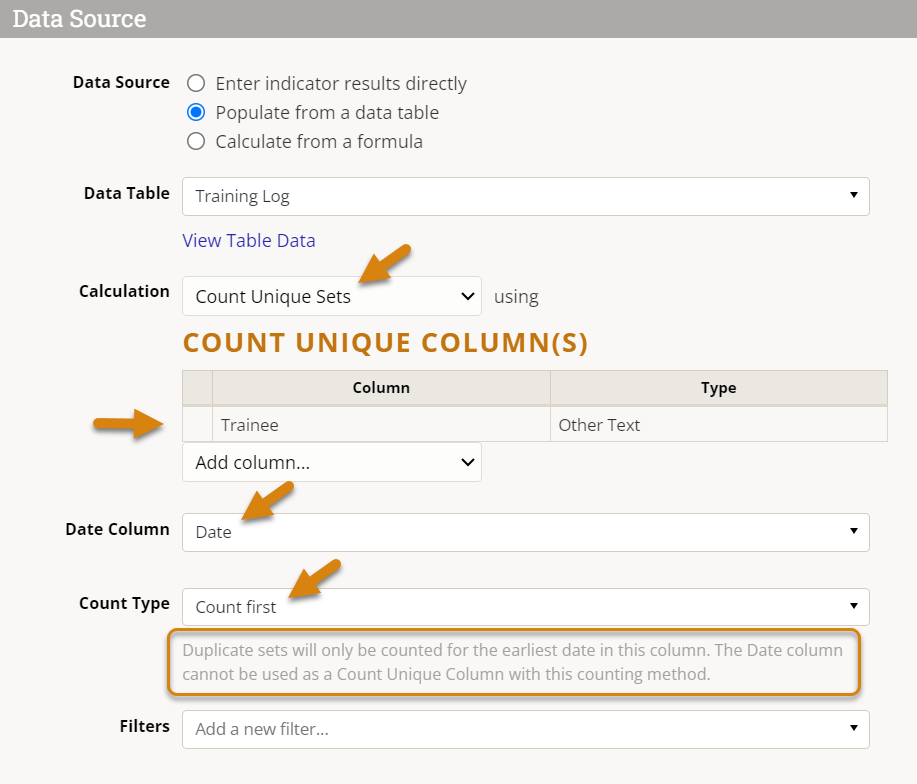
Before we look at the data generated by this indicator definition, let's consider what we've just instructed DevResults to do: "Find unique Trainees (based on their name/email), and if multiple records exist for any one trainee, only count the first one, on the date of their first training."
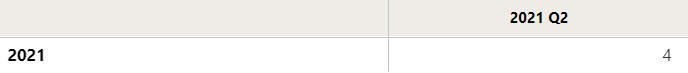
Result: Because all four characters took their first training in FY2021 Q2 (Jan-Mar), the Count First total is 4. All trainings that occurred in Q3 (Apr-Jun) are ignored because they are repeat trainees, even if the trainees are taking different courses.
You can learn more about the effect of Disaggregations and Filters on Count First and other Count Unique Sets indicators below.
Count Type: 'Count Unique Per Date'
Count Unique Per Date deduplicates sets that share the same exact date. That date is also used for associating the deduplicated data with a reporting period.
When dates vary widely within a reporting period, deduplicating by exact date can be useful for answering related but nuanced questions like:
- How many training days did we facilitate last quarter?
- How many "person-training-days" did we deliver?
- Practically, how many lunches or travel vouchers do we need to provide registrants, regardless of how many courses they plan to attend in a single day?
Even if some days were sparsely attended and others were more popular, Count Unique Per Date will ensure that each day (or person-day, depending) is counted once and only once.
When there is only one date per reporting period — either by happenstance or because the data table has been designed that way, e.g. with an "Actual Date" column and a separate "Last Day of Reporting Period" column — then Count Unique Per Date is equivalent to Count Unique Per Reporting Period.
In our Star Wars example, this means that we will count each "person-training-day" only once, regardless of how many trainings a single trainee attended on the same day. (Before you proceed, try to determine on your own from the Training Log above what the FY2021 Q2, Q3, and combined total will be for the indicator "# person-training-days facilitated.")
To define a Count Unique Per Date indicator, you will need to do the following:
- Select Count Unique Sets as the calculation method.
- Add the Trainee (name/email) column to the Count Unique Column list, as the unique ID we are using to distinguish one trainee from another.
- The Date column will be added for you when you select a Count Type.
- Select the Date field in the Date Column dropdown, which will be used 1) to deduplicate data based on date, 2) to determine which reporting period to record the data in (this may already be selected for you if only one date type field exists).
- Select the Count Unique Per Date option from the Count Type dropdown (note that a brief explanation of how this Count Type works will be provided below).
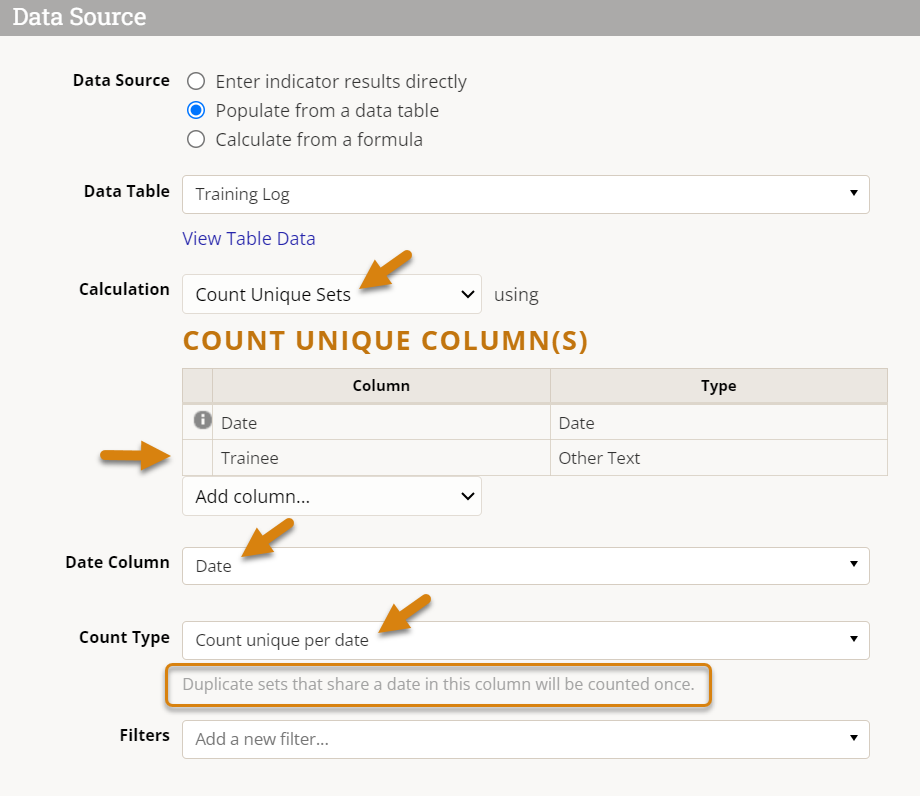
Before we look at the data generated by this indicator definition, let's consider what we've just instructed DevResults to do: "Find unique records according to the Trainees' name/email as well as the date of their training; if multiple records exist for any one Trainee + Date combination (i.e. one person took multiple trainings on the same date), only count it once."
If we refer back to the Training Log table, we see that 3 dates repeat: 3 Jan 2021 (both Luke), 25 Mar 2021 (Chewie and Han), and 12 May 2021 (Chewie and Han again); the other two training dates (both belonging to Leia) fell on different days. If we were only looking at the Date column and not the Trainee, we would have a total of 5 unique dates. However, if we factor in the combination of Trainee + Date, only Luke's two training sessions on 3 Jan 2021 represent a true duplicate.
Result: Given the logic above, the deduplicated Count Unique Per Date total of person-training-days is 7 overall — one less than the Count All total of 8 — 5 in FY2021 Q2 and 2 in Q3. This concept of "person-training-days" may be a strange and slightly non-intuitive concept, but it is useful for some metrics.

You can learn more about the effect of Disaggregations and Filters on Count Unique Per Date and other Count Unique Sets indicators below.
Count Type: 'Count Unique Per Reporting Period'
Count Unique Per Reporting Period deduplicates sets that share the same reporting period. It is similar to Count Unique Per Date, but instead of using an exact date to deduplicate, it converts the date into its associated reporting period automatically, and then uses the reporting period as part of the set comparison instead.
This is a more conventional and common count unique method than Count Unique Per Date. It can be used to answer basic questions such as "how many unique individuals have we trained this quarter?" Deduplicating within reporting periods is often less complicated than deduplicating between or across reporting periods because we don't have to consider the time dimension as part of the set comparison; that's a job for Count First or Deduplicate Across Dates.
Count Unique Per Reporting Period is actually a special case of Count Unique Per Date where all dates within a reporting period are the same. Previously, many DevResults users would maintain two date fields — one with the actual date that something occurred, and another that reflected the last day of the reporting period in which that actual date fell, typically Mar 31, Jun 30, Sep 30, or Dec 31. Count Unique Per Reporting Period makes that manually conversion unnecessary.
Note: As of July 2023, you no longer need to maintain "Last Day of Reporting Period" columns in your data tables in order to calculate deduplicated counts per reporting period; Count Unique per Reporting Period will convert any date within a reporting period on the fly automatically.
In our Star Wars example, counting unique individuals trained by reporting period means that if we should expect no more than our total pool of trainees (4 - Luke, Leia, Han, Chewie) to be counted each quarter, but we aren't intending to deduplicate them across quarters, so we may get a combined total greater than 4. (Before you proceed, try to determine on your own from the Training Log above what the FY2021 Q2, Q3, and combined total will be for the indicator "# unique individuals trained per quarter.")
To define a Count Unique Per Reporting Period indicator, you will need to do the following:
- Select Count Unique Sets as the calculation method.
- Add the Trainee (name/email) column to the Count Unique Column list, as the unique ID we are using to distinguish one trainee from another.
- The Reporting period for Date column will be added for you when you select a Count Type.
- Select the Date field in the Date Column dropdown; this date will be converted to the appropriate reporting period, which will then be used 1) to deduplicate data based on reporting period date range rather than date alone, 2) to determine which reporting period to record the data in.
- Select the Count Unique Per Reporting Period option from the Count Type dropdown (note that a brief explanation of how this Count Type works will be provided below).
Before we look at the data generated by this indicator definition, let's consider what we've just instructed DevResults to do: "Find unique records according to the Trainees' name/email as well as the reporting period in which the date of their training fell; if multiple records exist for any one Trainee + Reporting Period combination (i.e. one person took multiple trainings in the same reporting period), only count it once."
If we refer back to the Training Log table, we see that 6 records exist in FY2021 Q2 and 2 in Q3. Within Q2, Luke appears twice (counted once), Leia appears twice (counted once), and Chewie and Han each appear once. In Q3, Chewie and Han appear again, but since we're only deduplicating within a reporting period, we don't consider these to be duplicates as they occurred in a different reporting period than their earlier trainings.
Result: Given the logic above, the Count Unique Per Reporting Period total for Q2 count is 4, and the Q3 total is 2, for a combined total of 6.

You can learn more about the effect of Disaggregations and Filters on Count Unique Per Reporting Period and other Count Unique Sets indicators below.
Count Type: 'Deduplicate Across Dates'
Deduplicate Across Dates sets across all time, dates, and reporting periods, similar to Count First. The main difference is that instead of selecting the 'first' observation, Deduplicate Across Dates simply records all values at the most recent date, as if to say "up to this point in time, here's the unique count."
As you can see in the Count Unique Per Date and Per Reporting Period examples, there are situations where the time dimension can "double count" results in ways that may be unexpected to some users. In our Star Wars example, we know that we only have 4 characters, as represented by 4 unique emails in the Trainees column. The question is, given that they are trained in different reporting periods, when do we report or graph these results?
If we want to include a time/reporting period dimension in our graphs, then we have to include it in our unique set comparisons. However, that means that we'll end up counting the same person trained on different dates or in different reporting periods twice. In order to remove all dates/reporting periods from the Count Unique Columns list, we have to come up with a convention for recording indicator values in time.
Count First is one such convention — record deduplicated values on the date in which they first appeared, and associated it with the appropriate reporting period based on that date. Deduplicate Across Dates is another — record deduplicated values on the most recent date of the entire dataset, then associate that date with a reporting period.
Note: By associating all records with a single date, Deduplicate Across Dates will never present multiple reporting periods of time series data. Instead, only a single reporting period of data will ever exist, and this reporting period will change if more recent data is added.
So which is better for deduplicating data across time periods — Count First or Deduplicate Across Dates? That depends largely on your data, your context, and your expectations. For instance, Deduplicate Across Dates often surprises people who expect to see multiple quarters of historical data but instead see a moving, ever-growing total in a single recent quarter. Count First has the benefit of providing static historical data based on first observation or interaction, but this may also be unexpected. Let's say after a year or so nearly all trainees are repeat participants; a Count First indicator might show extremely low counts for new trainees, and while that may be accurate, it may not be the story or the data that the project wants (although when viewed cumulatively, Count First may still be ideal). In general, Deduplicate Across Dates is the right choice if you don't need to see historical data but do want to see an up to date, absolutely unique count.
In our Star Wars example, we only want to count each character once, but we should expect the data to appear in the most recent reporting period implied by the data table rather than the spread of dates. (Before you proceed, try to determine on your own from the Training Log above what the FY2021 Q2, Q3, and combined total will be for the indicator "# unique individuals trained.")
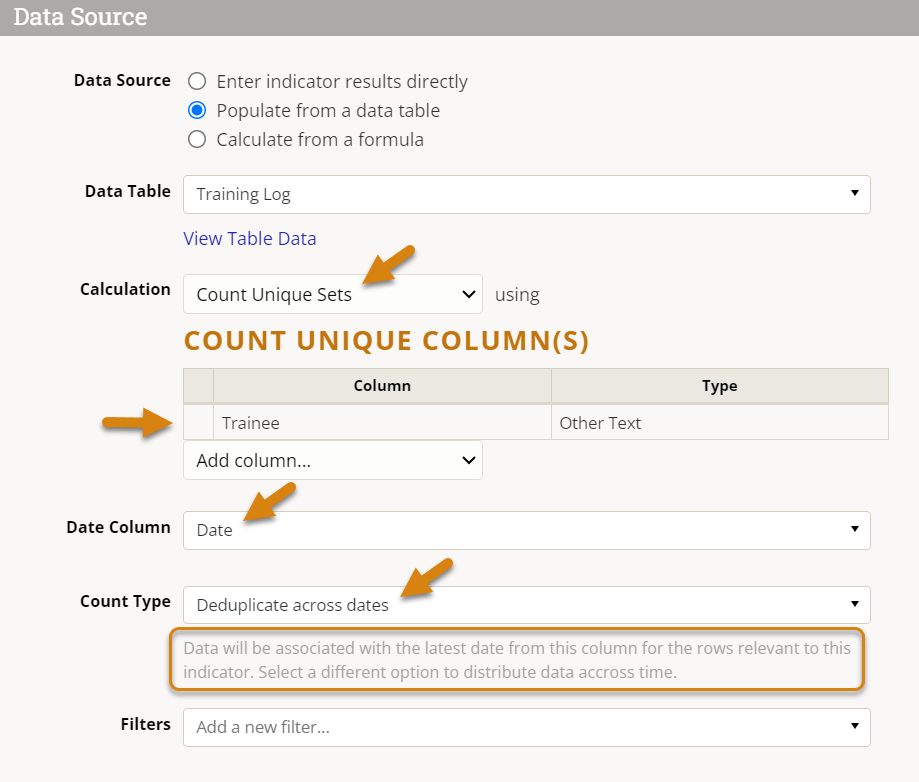
To define a Count Unique Per Reporting Period indicator, you will need to do the following:
- Select Count Unique Sets as the calculation method.
- Add the Trainee (name/email) column to the Count Unique Column list, as the unique ID we are using to distinguish one trainee from another.
- Select the Date field in the Date Column dropdown.
- Select the Deduplicate Across Dates option from the Count Type dropdown (note that a brief explanation of how this Count Type works will be provided below).
- Note that if you switch from one Count Type to another, the selected Date Column will be removed from the Count Unique Column list when you switch the Count Type to Deduplicate Across Dates as it cannot be used with this counting method.
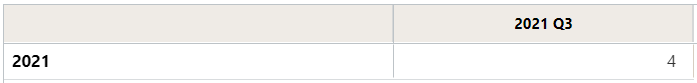
Before we look at the data generated by this indicator definition, let's consider what we've just instructed DevResults to do: "Find unique records according to the Trainees' name/email across all time, then associate all of the data with the latest date from the Date Column I selected."
If we refer back to the Training Log table, we know that we only have 4 characters, and indeed the Count First example returned 4, so we would only expect a total of 4 here. However, comparing these results to above, we see that while Count First returned 4 in FY2021 Q2, Deduplicate Across Dates returns 4 in Q3 — because the most recent date from the table, 12 May 2021, falls in 2021 Q3. Again, it's as if this indicator is telling us: "As of 2021 Q3, you have trained 4 unique individuals."
Result: Given the logic above, the Deduplicate Across Dates total is equivalent to the Count First total of 4, but in the most recent reporting period within the data (FY2021 Q3) rather than the first reporting period for each unique individual (Q2).
You can learn more about the effect of Disaggregations and Filters on Deduplicate Across Dates and other Count Unique Sets indicators below.
Adding Disaggregations
Just like any indicator, you can assign disaggregations to count unique indicators, but with one major caveat:
Note: Unlike any other indicator type, adding disaggregations can change the definition of your unique set and therefore change the results of that indicator relative to a similar but non-disaggregated indicator.
To see why, let's return to our example from a galaxy far, far away, embellished with one additional column.
We'll consider the first Count Type, Count First, which is fairly straightforward and intuitive — count each unique individual and record the value in the reporting period in which their first training occurs. From the example above, we know that although Luke and Leia both took two courses in the same reporting period, they are still just one person each — Force projections notwithstanding. Therefore, a Count First indicator would deduplicate these records, add their results to Han and Chewie, for a total of 4 unique people.
Now let's pretend we wanted to disaggregate this indicator by the trainee's home planet.
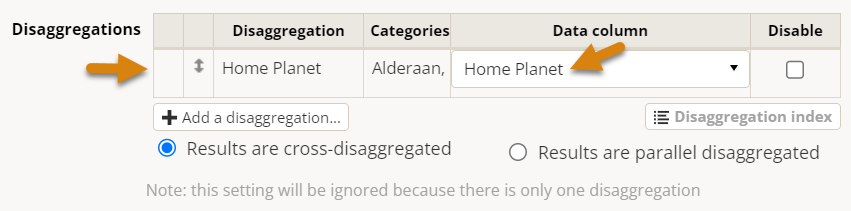
Note that adding a disaggregation required us to specify which column in our data table the indicator disaggregation would find the expected categorical data. This may feel tedious if there is only one column for each disaggregation of the same name, but necessary if you have multiple columns of the same disaggregation (for instance: gender of trainee, gender of trainer) that need to be referenced by different indicators.
Note also that adding a disaggregation automatically added the Home Planet column to our Count Unique Columns list. Holding your mouse over the gray info circle reveals why: "Enabled disaggregations are always included in count unique sets." We'll see why in a moment.
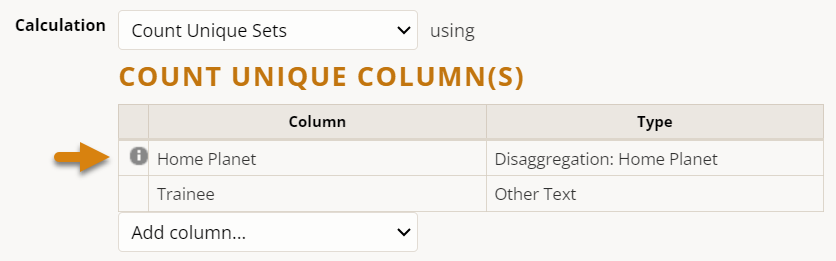
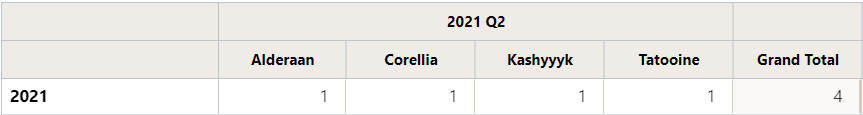
Adding this column to our data table, to our Count Unique Column list, and to the indicator disaggregation list yields expected results — 4 unique individuals, each hailing from a different home world. Note that each person's home planet is an immutable part of their demographic background, and therefore each person and their data will only be associated with one planetary category from this disaggregation, never two or more.
So far so good.
Now let's further disaggregate this indicator by Training Type.
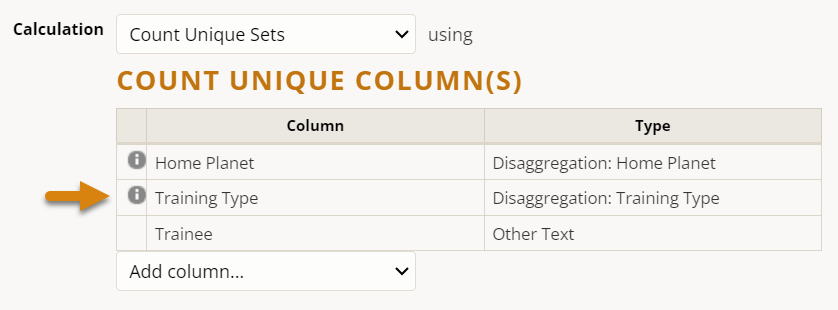
Suddenly we see that our indicator results have changed significantly — from a total of 4 to 7, with results spread over two quarters now — but the underlying data table hasn't changed at all!
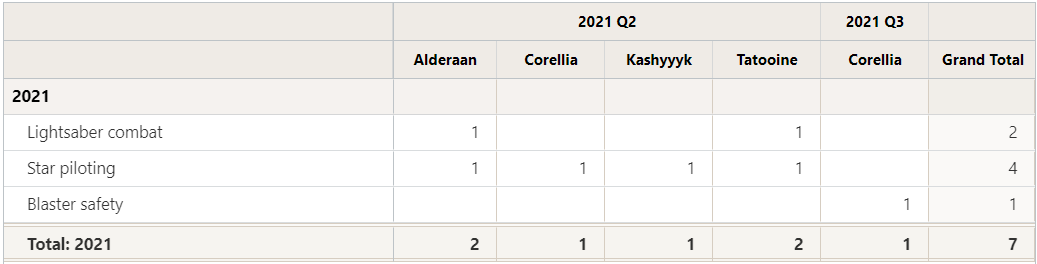
If we look back at our Training Log table and make a list of unique sets of Trainee name/email + Home Planet + Training Type sets, we start to see why this may be.
- Luke - Tatooine - Lightsaber combat
- Luke - Tatooine - Star piloting
- Leia - Alderaan - Star piloting
- Leia - Alderaan - Lightsaber combat
- Chewie - Kashyyyk - Star piloting (appears twice, counted only once)
- Han - Corellia - Star piloting
- Han - Corellia - Blaster safety
Previously, we only counted Luke, Leia, and Han once each, and we counted Han's first (star piloting) training in Q2, not his second (blaster safety) training in Q3. By adding a disaggregation to the indicator, we added a new column to the count unique function, and by adding a new column, we changed the composition of the unique sets themselves.
But why did DevResults force us to add "Training Type" to the Count Unique Columns list in the first place? Try to imagine how you would disaggregate the original results (4) by Training Type. Which row would Luke's single result go into — lightsaber combat or star piloting? What about Leia's? Han's? Only Chewie, who just so happens to have the same disaggregation categories associated with each of his data table records, but this is the exception rather than the norm.
Let's consider a brief real world corollary to these make believe examples. You can imagine that adding an 'ethnicity' disaggregation to an existing count unique indicator won't affect the results, as long as each unique individual selects (or is recorded with) the same ethnicity category in each row of the data table. This new disaggregation adds no new distinguishing information to the unique set, and so no 'new' unique results are created. However, if you were to add a disaggregation for an age category, educational attainment, disability status, employment/occupation, or any other category that has the ability to change over time, you may start to see a single individual with two or more 'versions' of themselves — the younger and the older, the pre- and post-graduation, the employed and the retired, etc. There is no way to both count this person once and disaggregate that count by two or more categories; their result has to go in one row/column or the other.
In short, adding a disaggregation necessarily changes the definition of what constitutes a unique set. There are certain aspects or situations where a deduplicated figure might not change when disaggregated, but these tend to be few and far between.
The good news is: you can always (and should) create multiple indicators to answer different questions, such as "how many new people have we trained?" (e.g. Count First without a course or training type disaggregation) vs. "how many courses were taken for the first time?" (e.g. Count First with a course/training type disaggregation).
Adding Filters
You can add filters to any count unique indicator, just like with other types of data table indicators. Filters are a way of ignoring any rows of your data table that do not meet the criteria that you define.
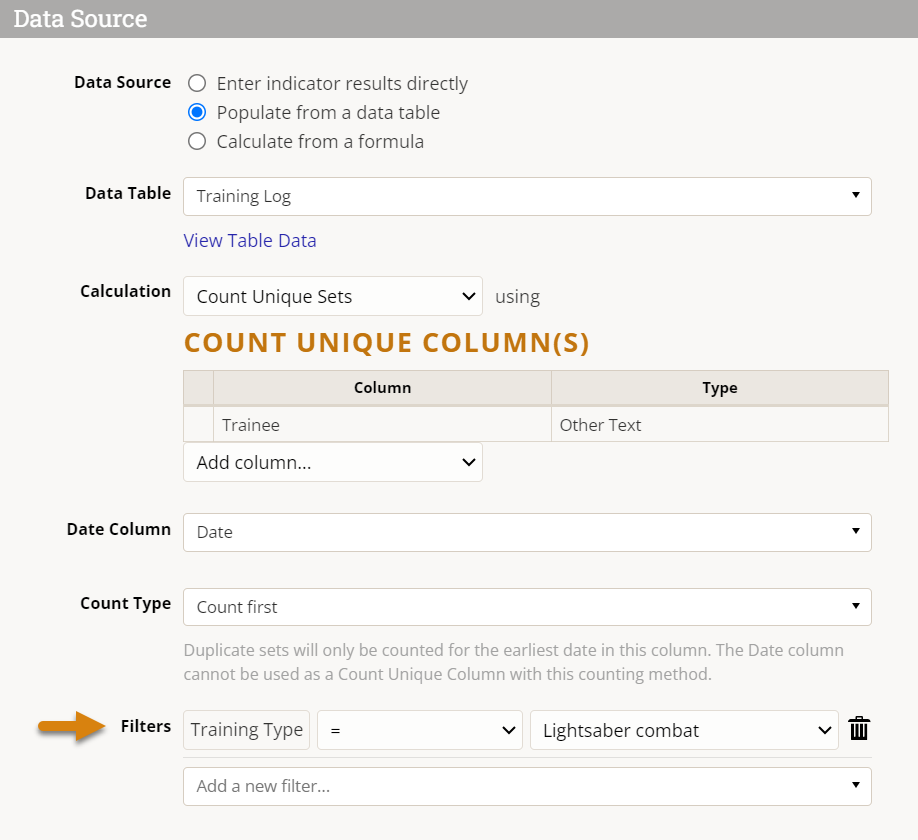
If we wanted to limit our analysis to a particular training type, we could set a filter for Training Type = 'Lightsaber combat', for instance. This indicator would now show how many unique trainees had completed the lightsaber training in each reporting period (2, both in FY2021 Q2 — Luke and Leia).
Frequently Asked Questions
Why isn't there' a "Count Last" Count Type (similar to Count First)?
Count Last would be the natural counterpart to Count First, but we have not identified a clear use case for it among our clients or users. More importantly, Count Last would have the unexpected affect of changing historical data by definition. Whereas Count First locks in an indicator's value once the reporting period closes, Count Last would be unpredictable, as any increase in present or future results could potentially be at the expense of historical results.
For instance, following on from our Star Wars example above, let's pretend that all four of our heroes came back to take "Moon vs. Space Station Identification" training in Q4. A Count Last indicator would record a value of 4 for "# people trained" in Q4, as expected, but it would also wipe out all data previously associated with Q2 and Q3, which would both be 0 now because none of those trainings were anyone's 'last'.
This is generally not useful, expected, or desirable from a data quality perspective. If you think otherwise, drop us a line at help@devresults.com!
Why doesn't Deduplicate Across Dates produce historical data? Is there a way to 'log' the results produced by Deduplicate Across Dates at the end of each reporting period, rather than constantly rolling them forward to the most recent date?
This is a completely understandable use case, and one that many users achieve 'manually' by simply recording the numbers produced by Deduplicate Across Dates at regular intervals. As explained above, it's a natural consequence of deduplicating across all time (all dates, all reporting periods). If you want to see the increase in unique observations or interactions, it's best practice to use a Count First indicator viewed cumulatively; this ensures that data contained in the same report or visual is also presented cumulatively, and is therefore more comparable.
Didn't answer your question? Please email us at help@devresults.com.