Once you've linked data tables to one another, you can design indicators that pull results directly from those tables. The options to design indicators from linked tables are exactly the same as when you populate from a single data table. Please refer to that article for detailed instructions on the various data table calculation options.
This article walks through the expanded options when populating from a linked data table and covers:
Note: Currently, linked tables are incompatible with the row locking feature.
Choosing geography and date column
Begin on the indicator's definition page. For data source, select populate from a data table and choose the linked table that contains information for this indicator.
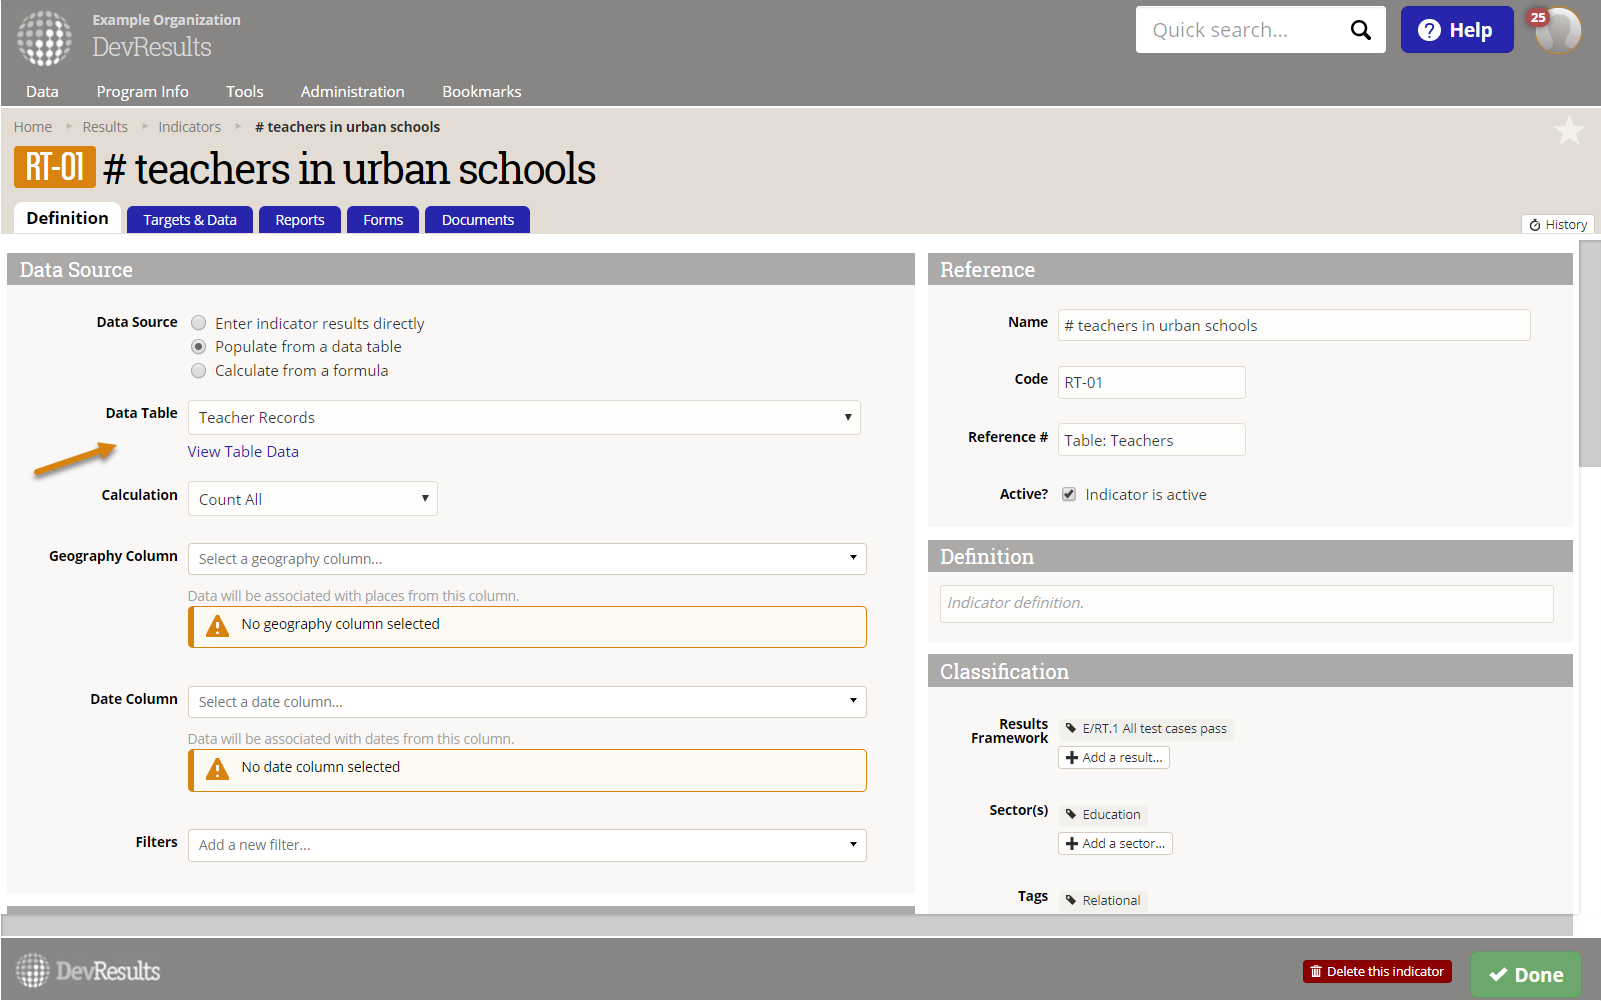
In this example, we are linking to a table of information on teachers. This table is pulling information from an additional tables that contain information on the school each teacher works in.
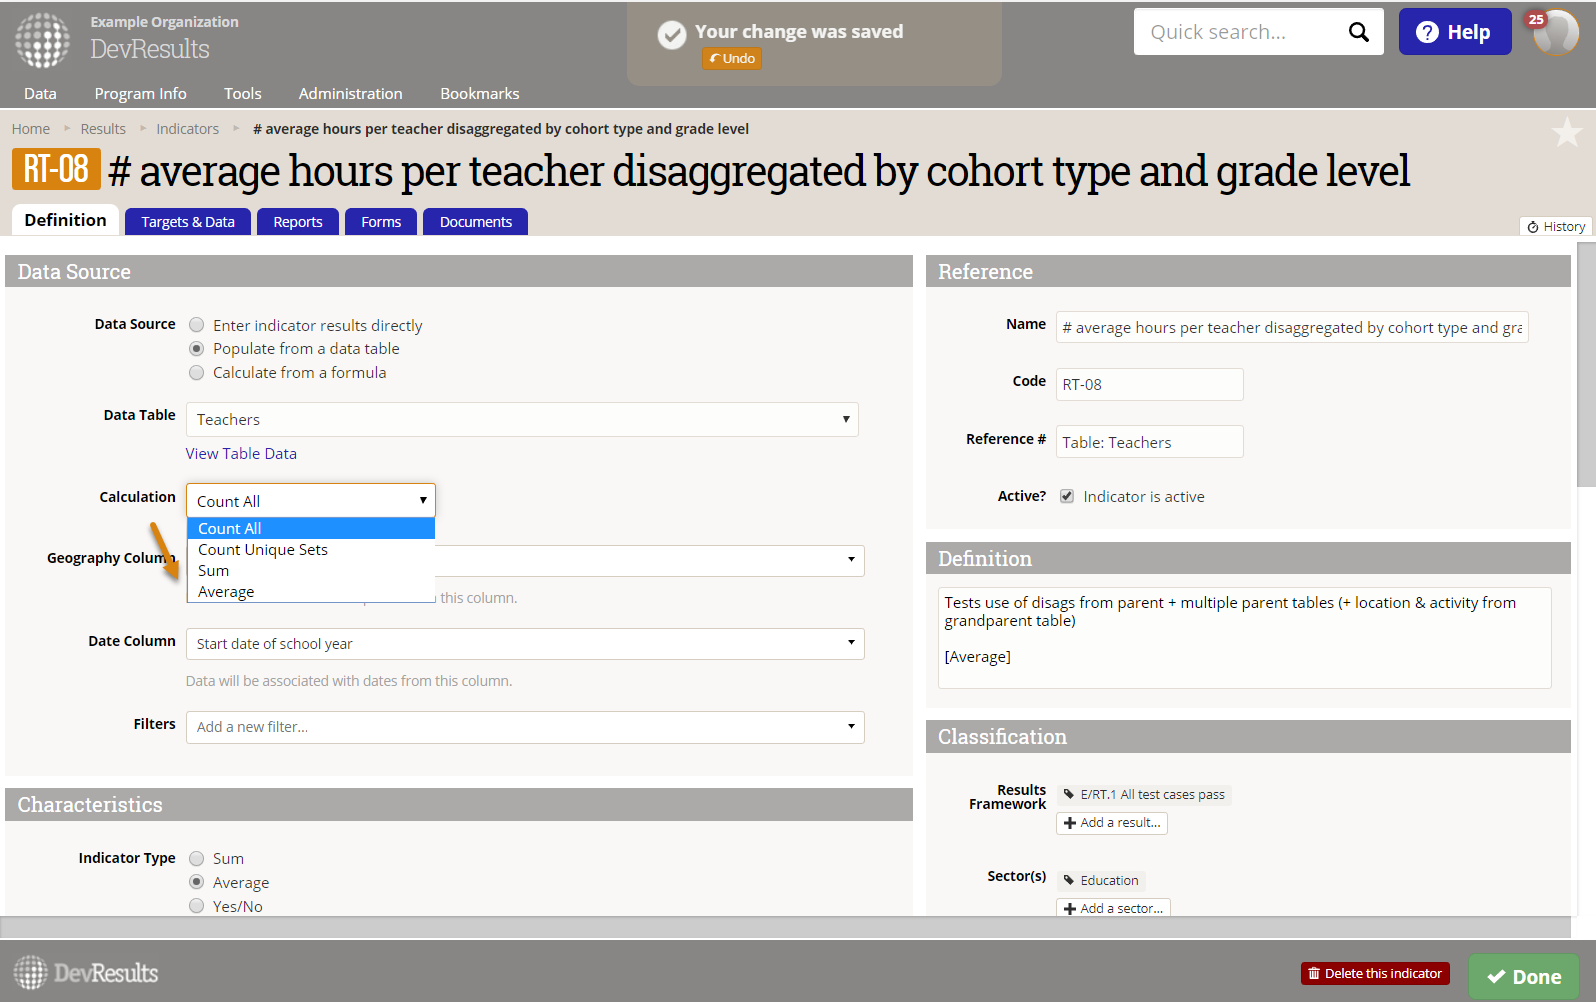
Next, select the calculation. You can either count all rows, count unique sets of columns, or get a sum or average of a column of numeric data. Additional configuration options will depend on which calculation type you use. This example shows the count all configuration.
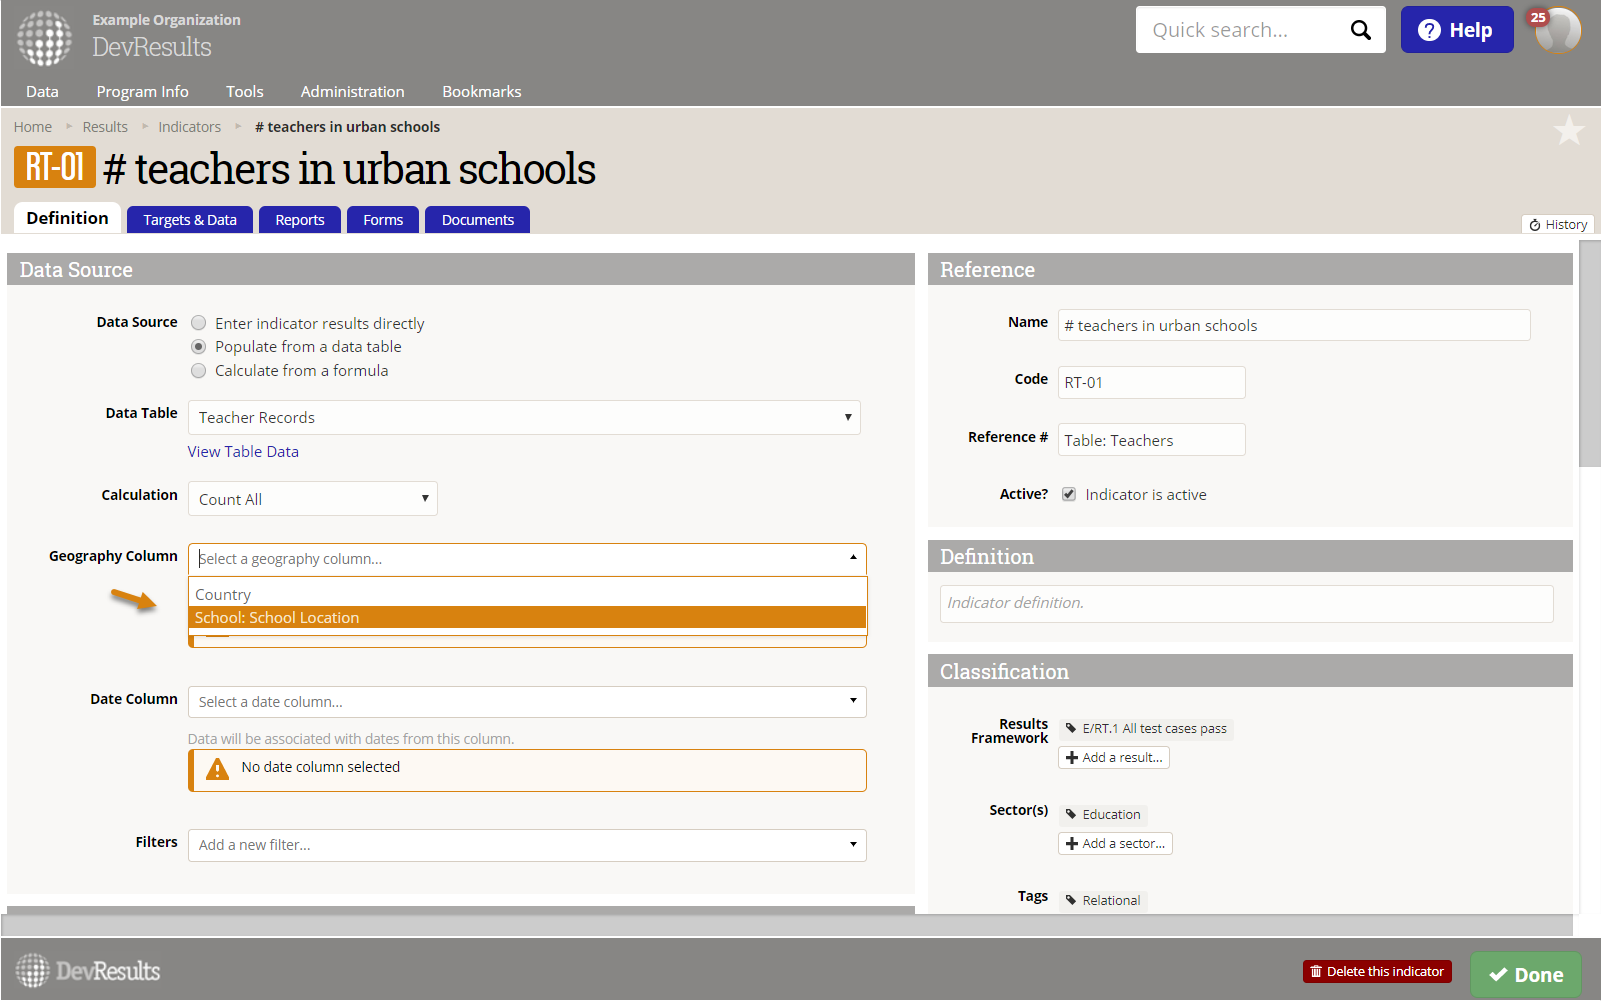
When populating from linked tables, you can choose geography and date columns from any of the tables available (in this case, we can choose a geography column from the "School" table). DevResults will show you the table and column names for all available geography and date columns.
Choosing filters
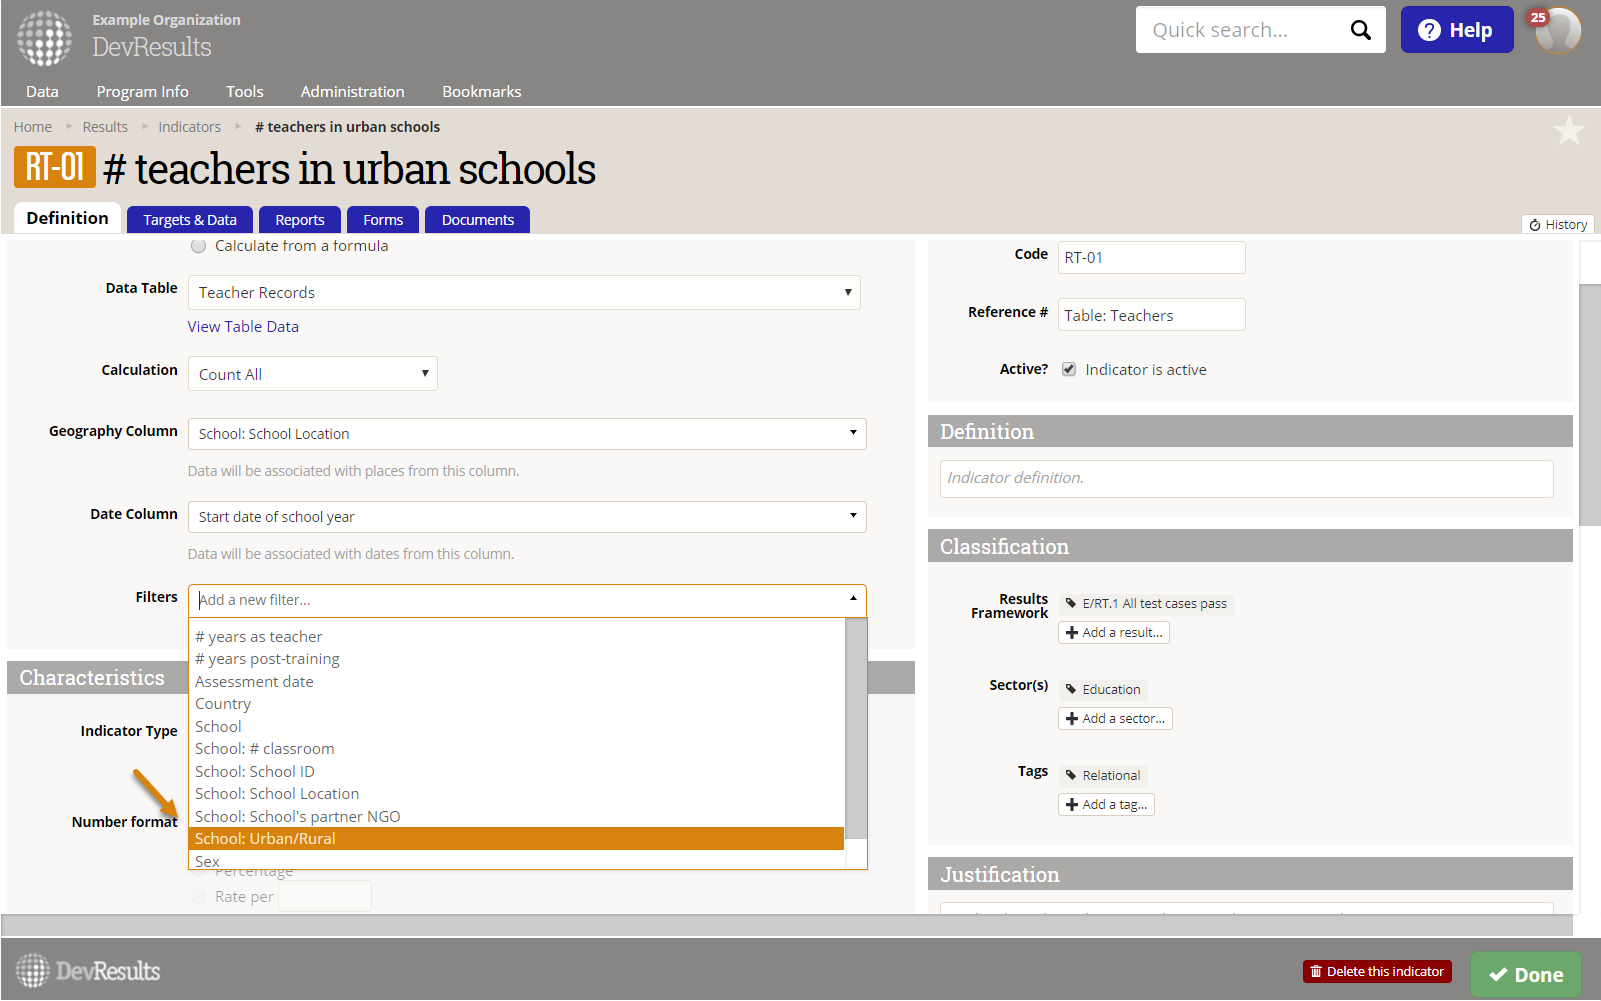
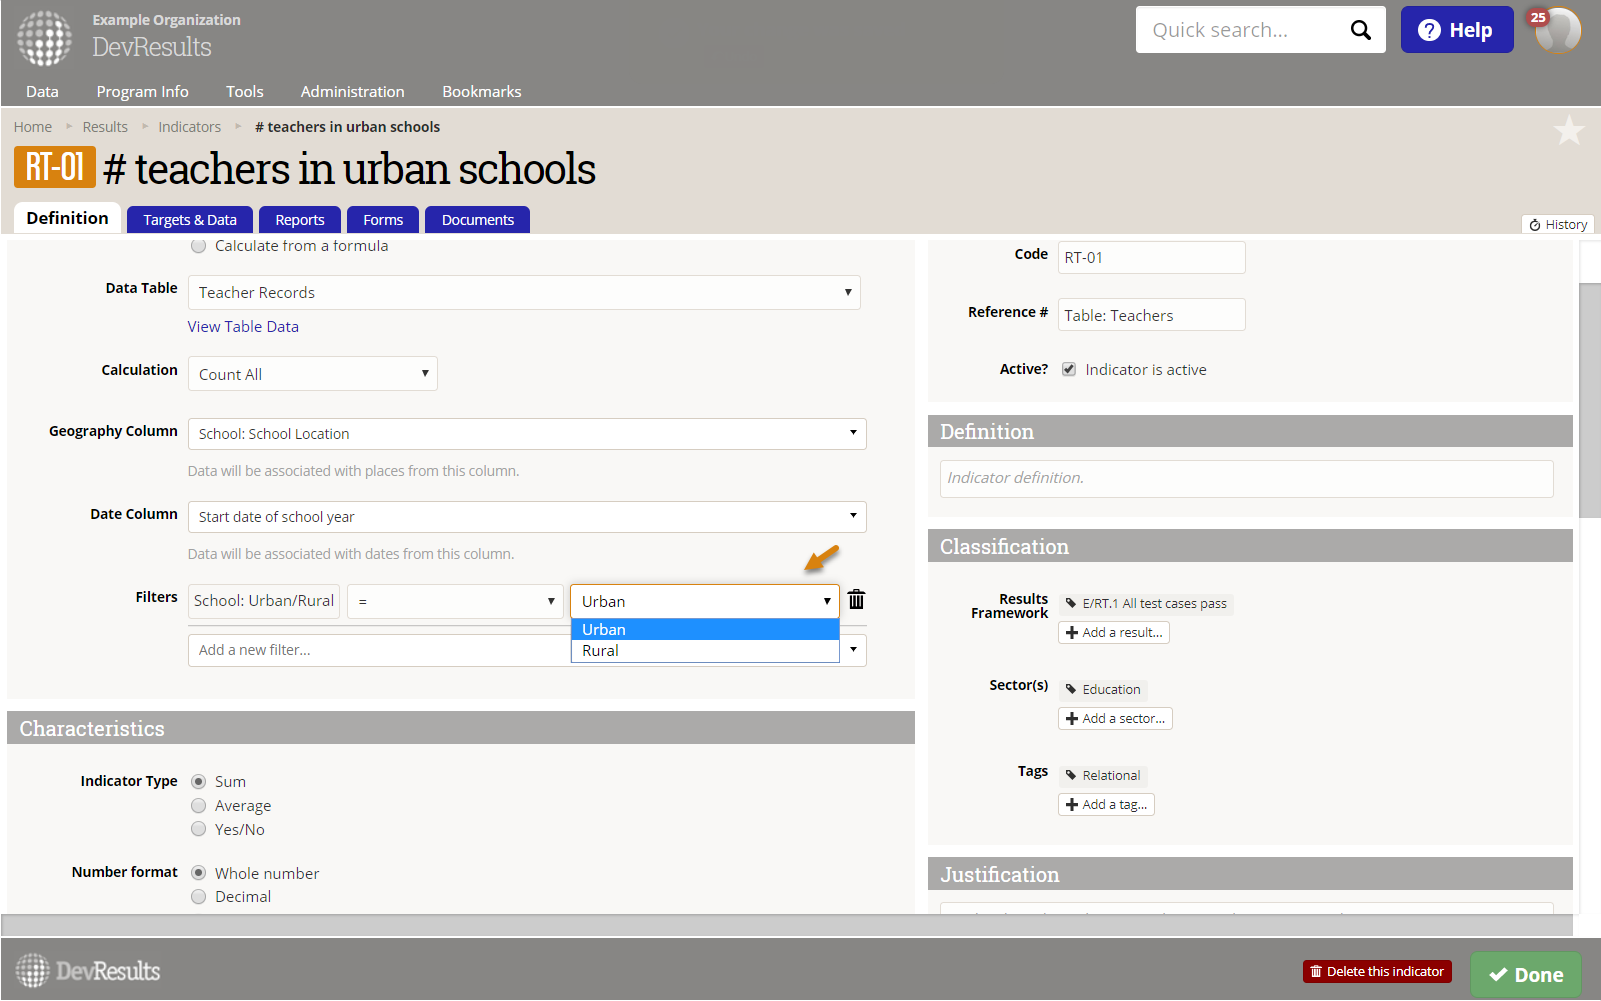
Similarly, you can choose to exclude rows from your calculation by applying one or more filters based on information from any of the tables available. In this case, we are choosing to only include rows where teachers are in urban schools. The column in question is in the "School" table.
Once you've selected a column, you can choose the value with which rows will be included or excluded:
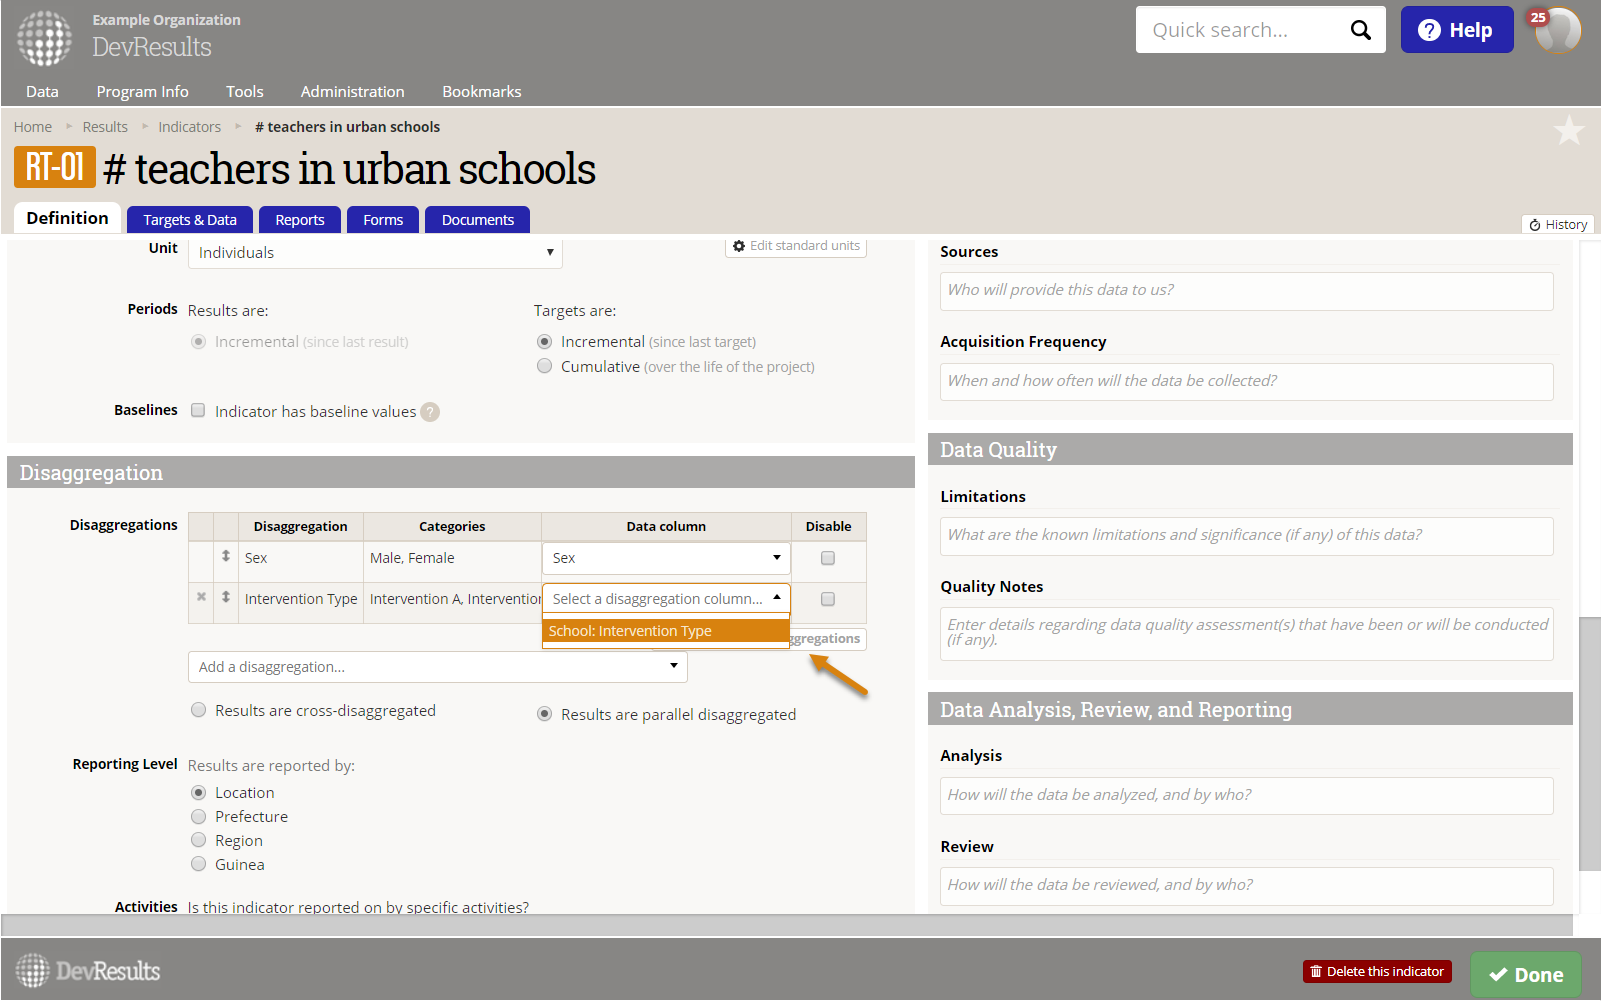
Choosing disaggregations
When populating from a linked table, users can also specify disaggregations from any available table. In the example below, the indicator is being disaggregated by 'Sex', which is from the "Teacher Records" table and "Intervention Type" which is from the "School" Table
Once a disaggregation has been added, you can click on the data column. DevResults will show you the columns from all available tables that match the disaggregation you selected.
Note: To report results separately for each project, a project column has to be added to the linked table. Currently, indicators cannot pull information from project columns in all available tables.
Choosing calculations
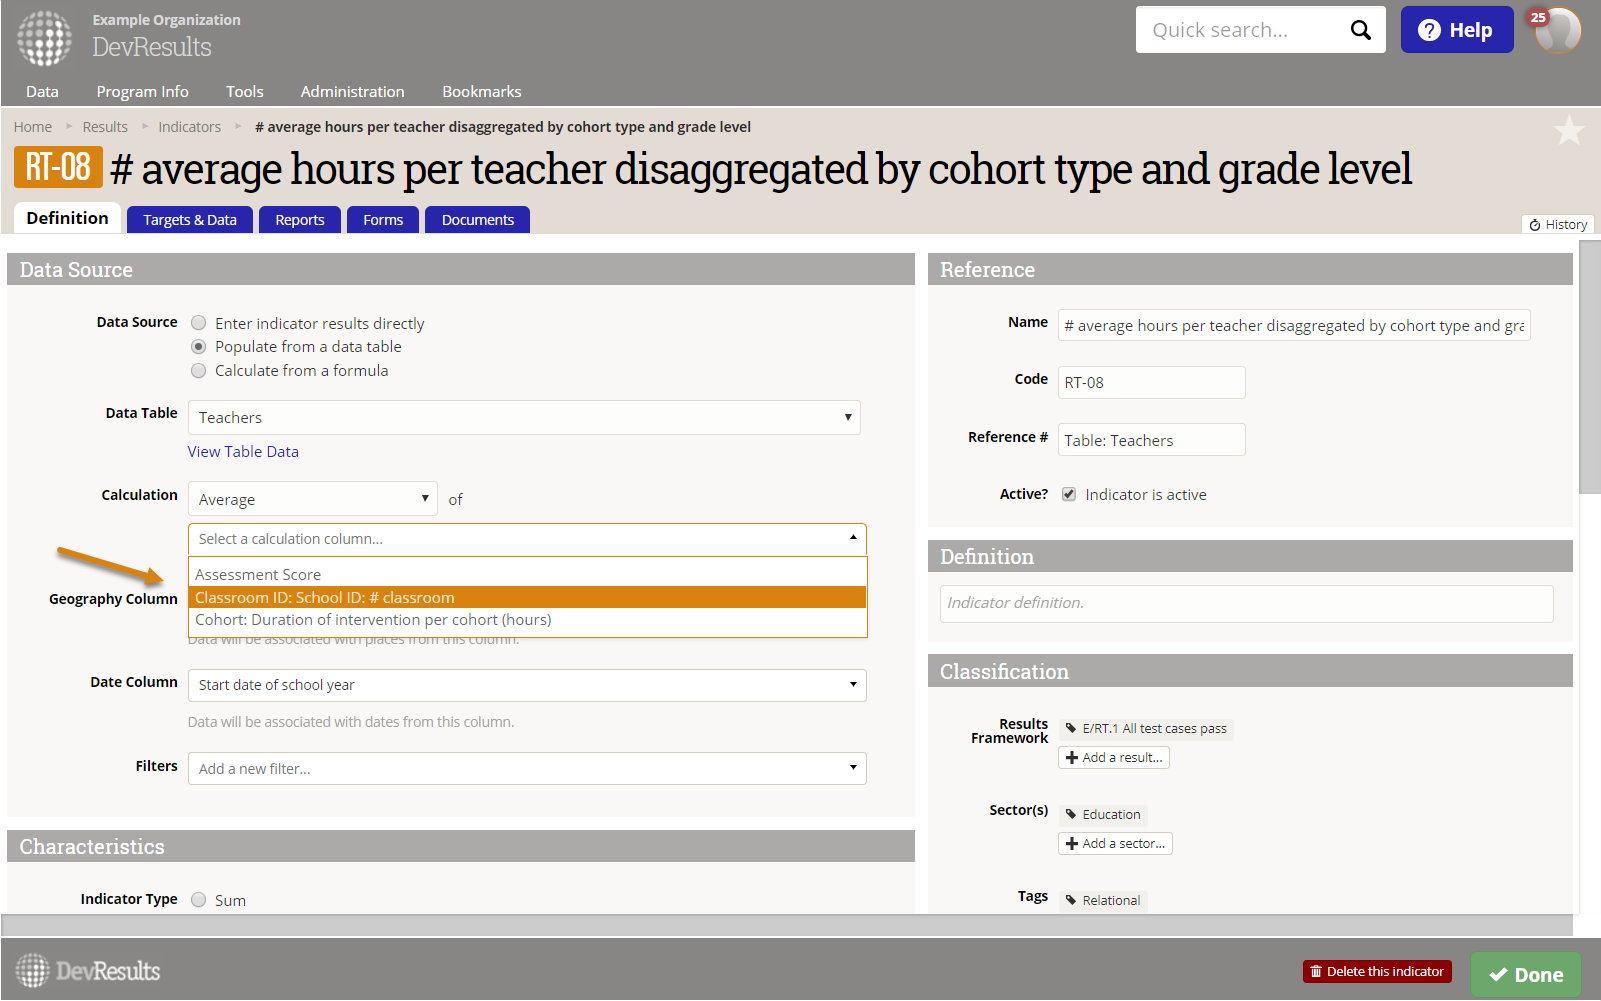
You can now choose to calculate results based on a numeric column in any available data table.
Select the calculation type:
You can then select a column. Similar to geography columns and date columns, DevResults will show you all available numeric columns.
Didn't answer your question? Please email us at help@devresults.com.