When you log in to DevResults, the first page you see is a dashboard. Each user can create and design as many dashboards as they'd like to show information relevant to them. Dashboards are edited by editing, arranging, resizing, adding, and removing tiles, or by configuring a MultiMatrix report.
On this page:
- Add or create a dashboard
- Types of tiles
- Default dashboards
- Push a dashboard
- Change dashboard ownership
- Embed dashboard tiles
- Download a dashboard image
Add or Create a Dashboard
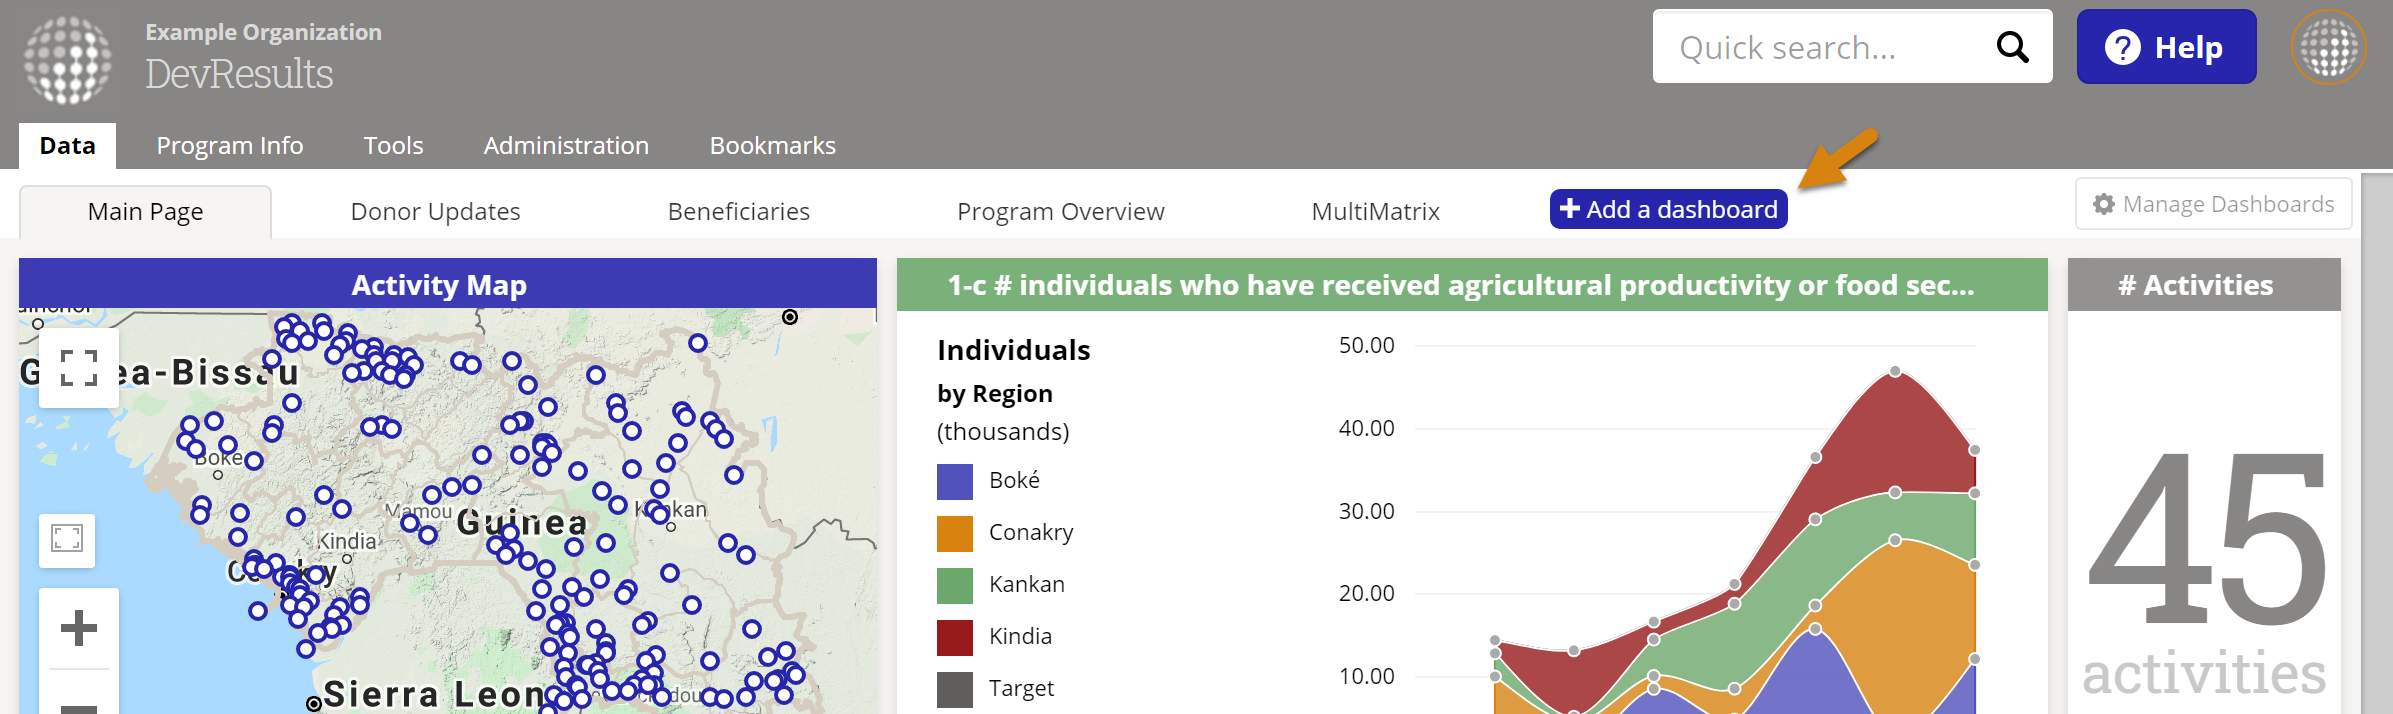
Dashboards allow you to create multiple views of information based on user and audience needs. To create a new dashboard, click the Add a dashboard button on the menu next to your dashboard(s).
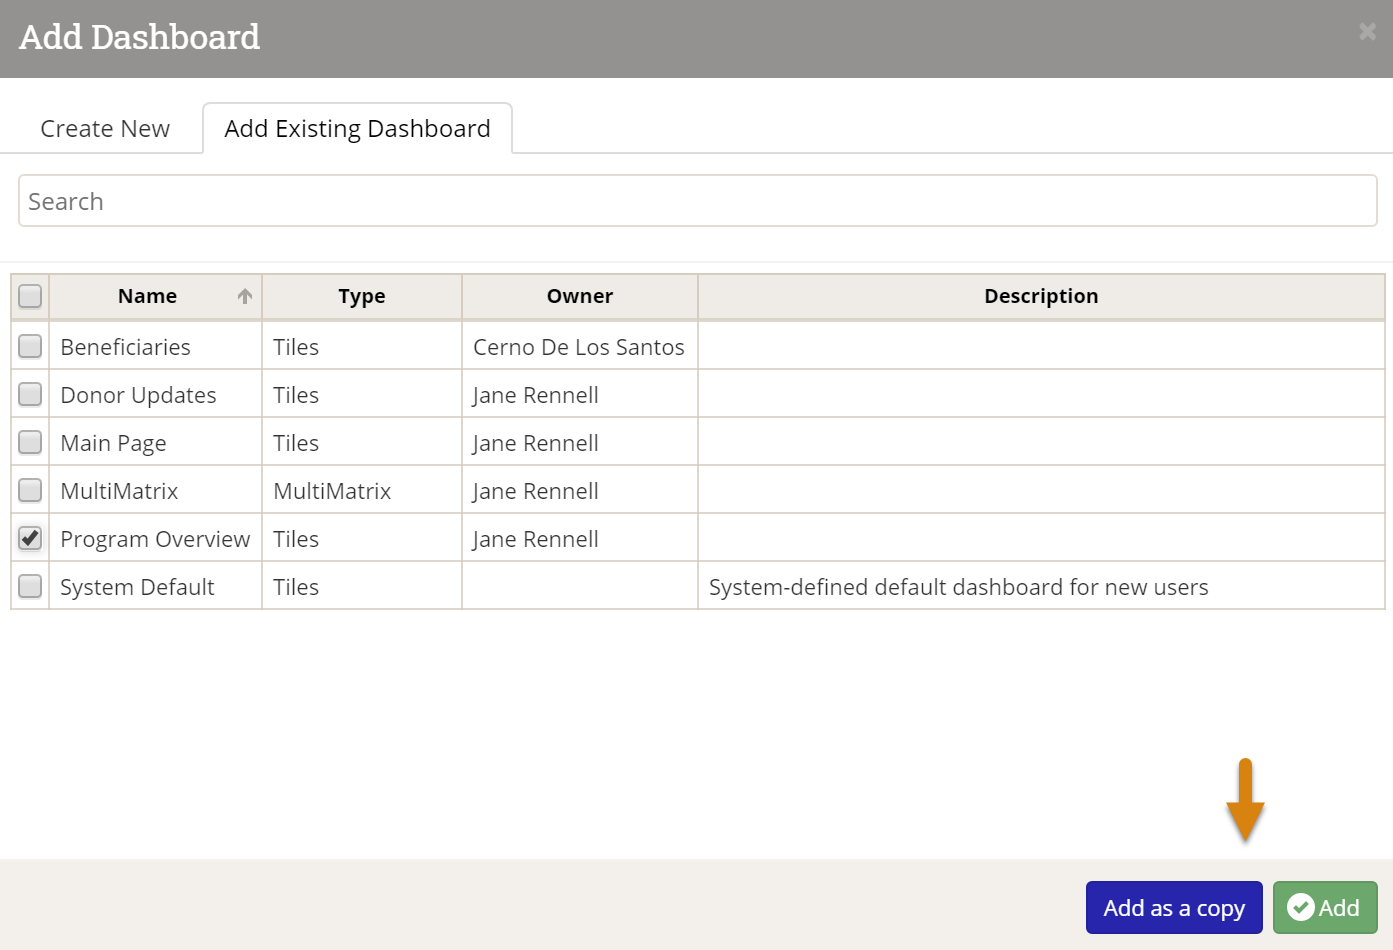
To add one or more existing dashboards to your collection, check the boxes next to the dashboard(s). Choosing Add as a copy will let you edit your own version of the dashboard without changing the original. Choosing Add will give you a view-only copy that reflects any changes the owner makes.
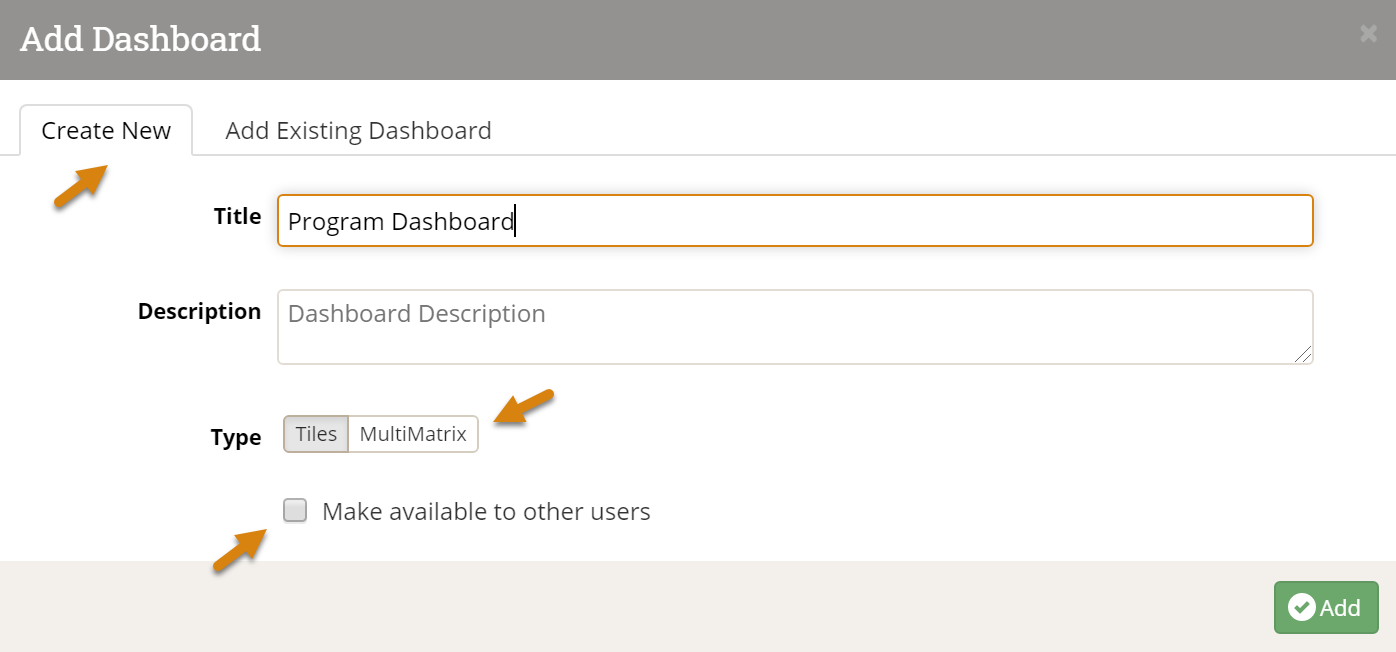
To create a new dashboard, switch to the Create New tab in the popup. Give the new dashboard a name, choose whether to create a MultiMatrix or Tiles dashboard, and choose whether to make this dashboard available to others. Click Add.
- For designing a Tiles dashboard, see below.
- For designing a Multimatrix dashboard, check out the MultiMatrix page.
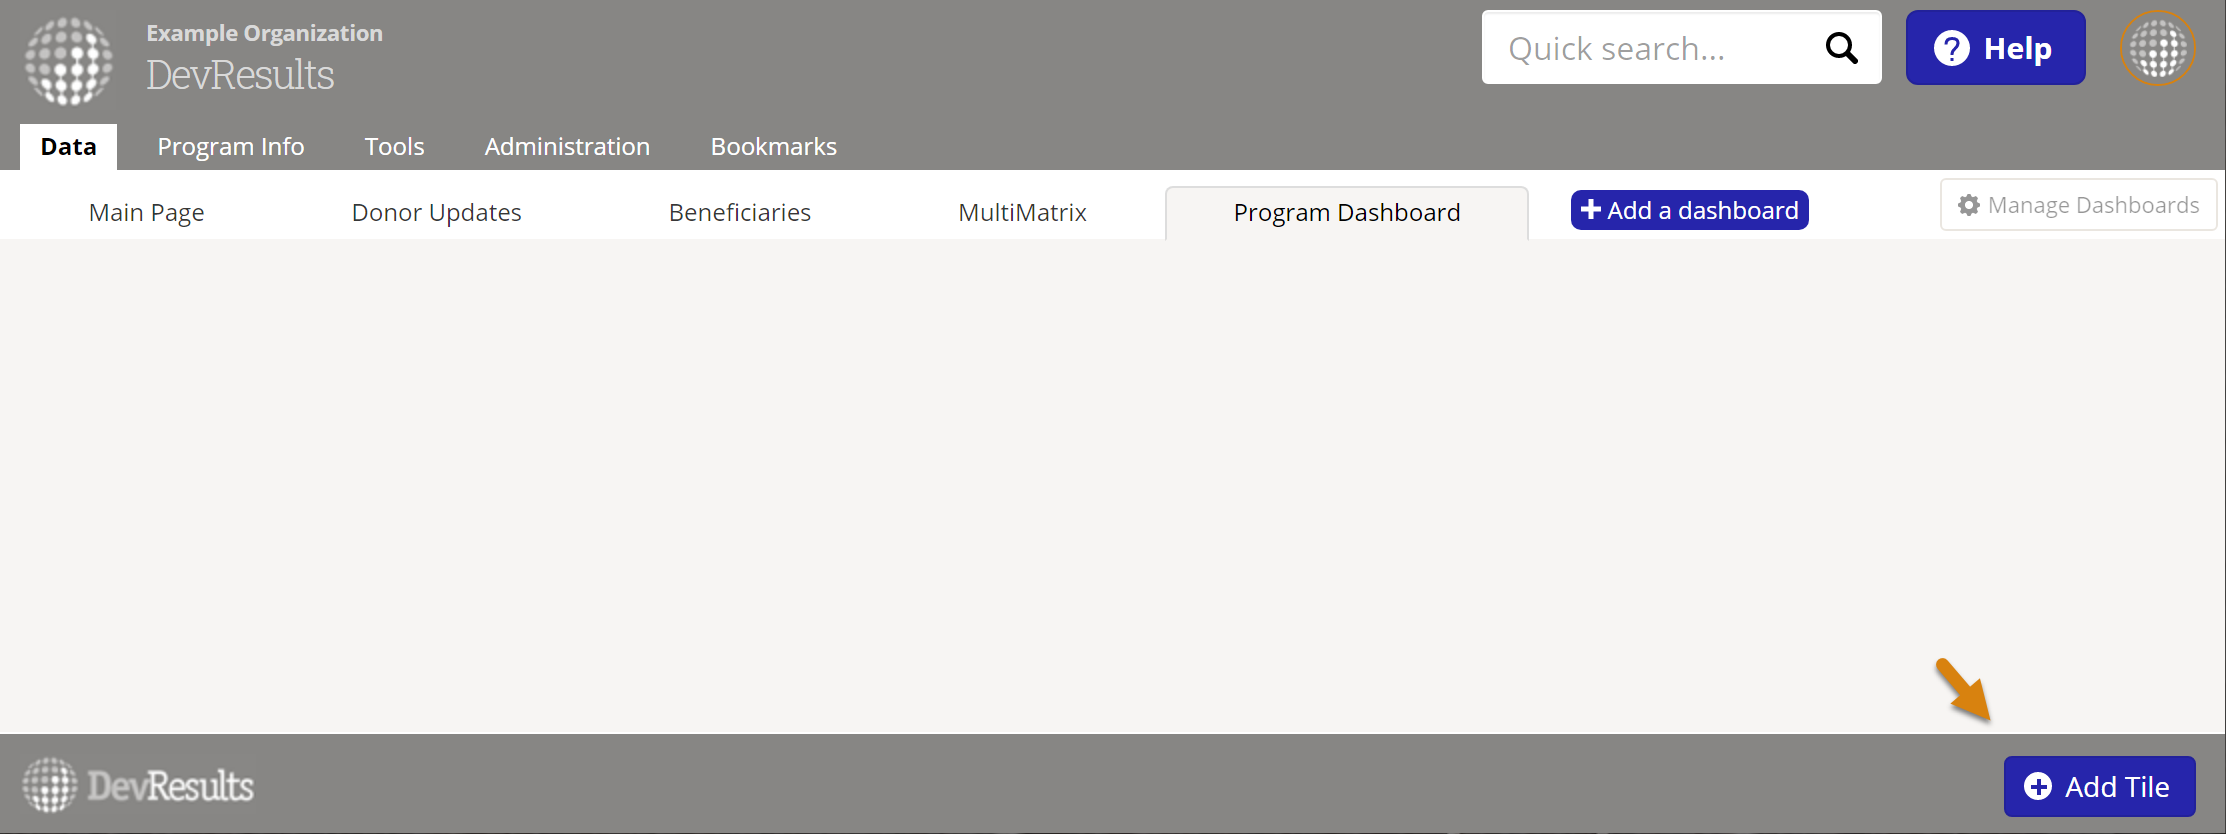
To add tiles to the new blank dashboard, click the Add Tile button at the bottom of the page.
Select which tiles you would like to add. If your tile is specific to an indicator, pick the indicator you'd like to show from the indicator dropdown. You can also change the title and color of the tile before clicking Add to create the tile.

The interactive tile will then appear on your dashboard. You can re-position your tile by dragging/dropping the colored bar at the top. You can resize it by clicking/holding the lower right-hand corner while adjusting the size.
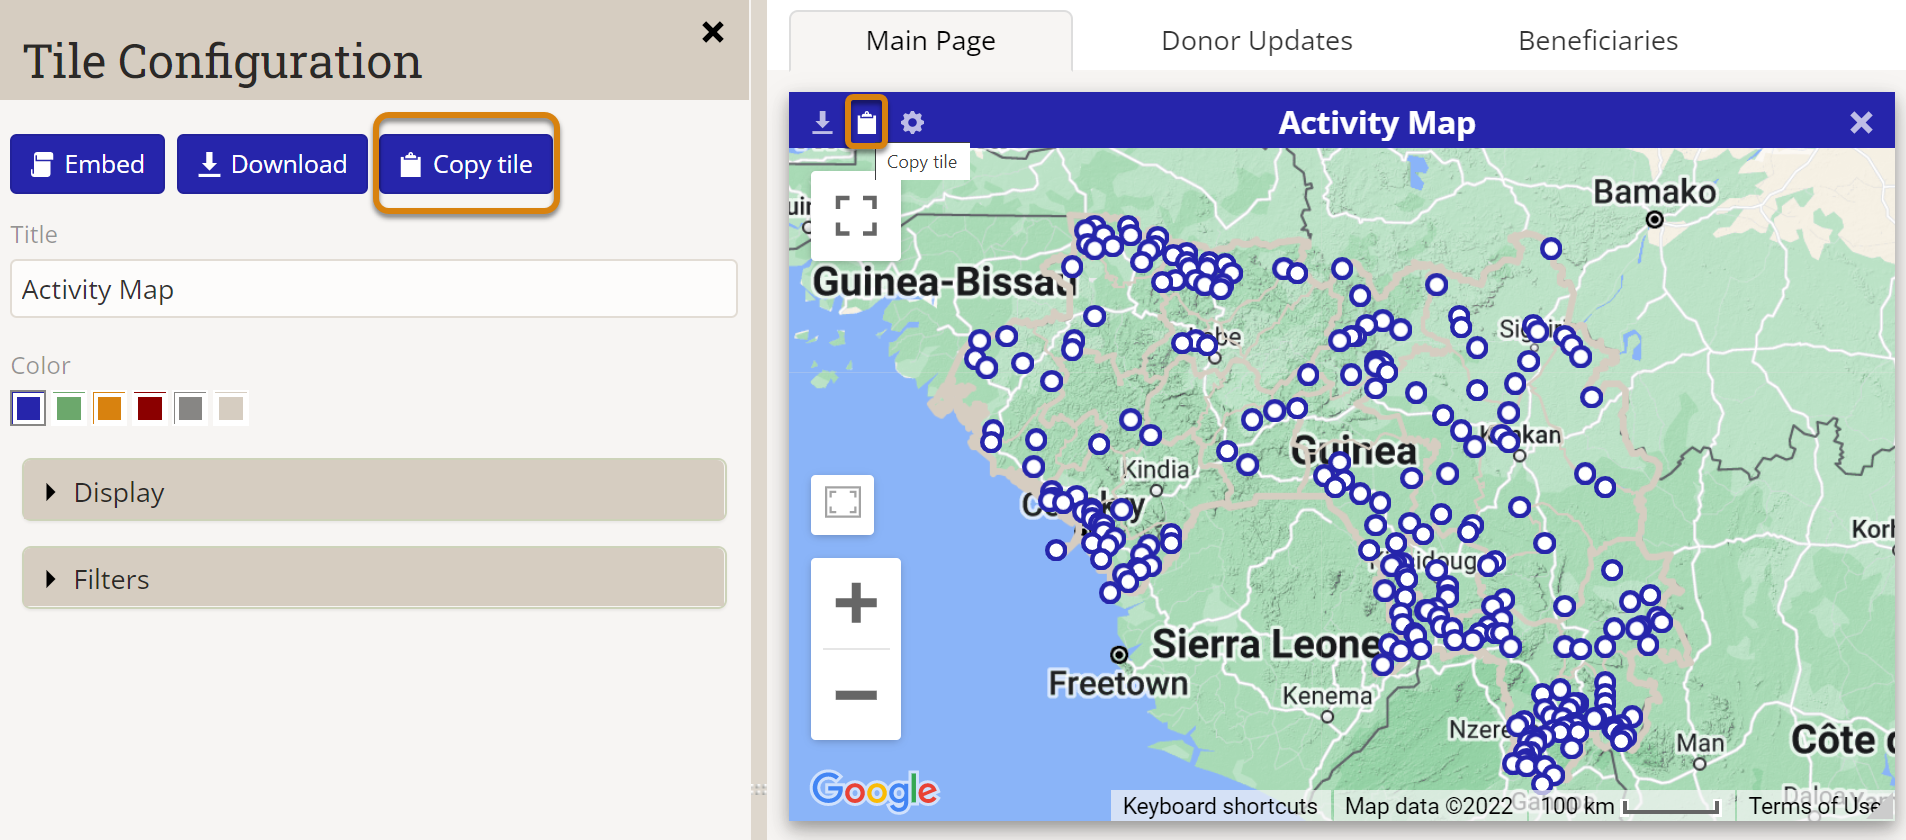
The new dashboard also allows you to configure the way in which each tile is structured. To do so, click the gear icon on the top left corner of the tile. Depending on the tile, you can choose to download the selected tile, make changes to the way data is being calculated, displayed, or filtered, and change the style of the visualization.
You can also copy configured tiles to other dashboards (for broader sharing), or even the same dashboard (for displaying data slightly differently without starting from scratch). To copy a tile, simply select Copy tile from the Tile Configuration menu, or just click on the clipboard icon in the tile header.
Tiles Types
- Indicator Map - Choropleth or graduated symbols maps for any single indicator.
- Indicator Pie Chart - Pie chart for a single indicator.
- Indicator Targets and Actuals - Column, stacked column, line, and area graph for a single indicator.
- Progress to Global Target - Shows good/warning/bad icons for indicator results compared to global targets.
- Progress to Project Target - Shows good/warning/bad icons for indicator results compared to global targets.
- Indicator Value - Actual result value for a single indicator for a reporting period or cumulative over time.
- Program Statistic - See Awarded, Obligated, Disbursed for information about program statistic options.
- Project Map - Shows administrative divisions, map overlays, and/or locations to which projects are assigned.
- Bookmarked Projects - List of (and links to) your personal bookmarked projects.
- Bookmarked Indicators - List of (and links to) your personal bookmarked indicators.
- Bookmarked Data Tables - List of (and links to) your personal bookmarked data tables.
- My Tasks - This tile shows any tasks assigned to you from all project checklists. See Checklists for more information.
- Markdown Text - This tile allows you to add formatted text to your dashboards. You can also use this tile to link to saved reports, documents, etc. elsewhere on your DevResults site.
- Matrix - A smaller, scalable version of a full-page MultiMatrix dashboard. See MultiMatrix for more information.
- Geotagged Photos Map - Displays a map with thumbnails of photos that are linked to locations in your locations list.
NOTE: The Project Map tile on the dashboard shows all geographies in DevResults that are assigned to projects, whether or not indicator results are reported at those locations.
Default dashboards
Each DevResults site has one default dashboard that appears for all new users. Users can remove the default dashboard from their collection of dashboards by clicking the x at the right end of the dashboard's tab.
When DevResults sites are created, the default dashboard is called "System Default" and cannot be edited. Users with the View & Edit permission for Program Settings can designate a different dashboard (that they've created) as the default for their site.
To do so, click the Manage Dashboards button in the upper right.

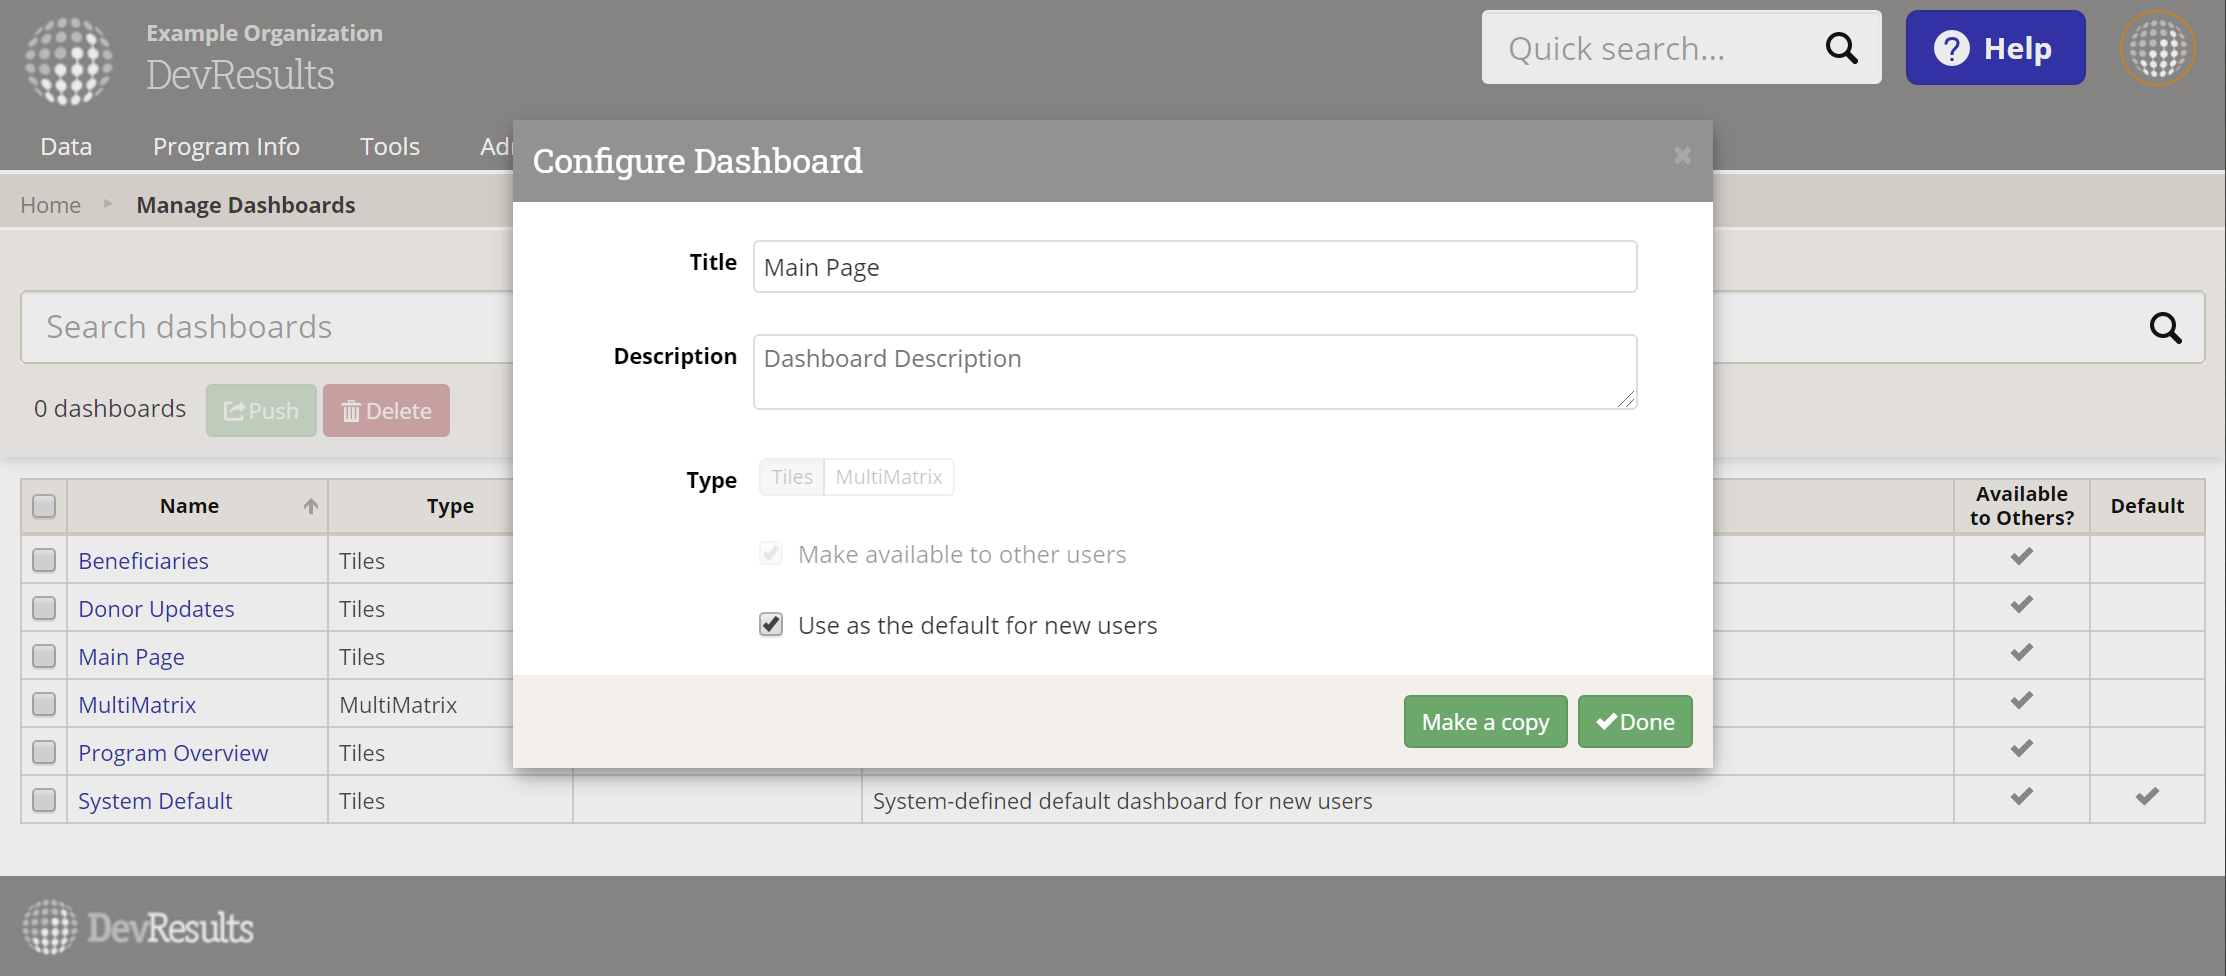
This will open the Manage Dashboards Index. The Default column will show a checkmark for the current default dashboard:
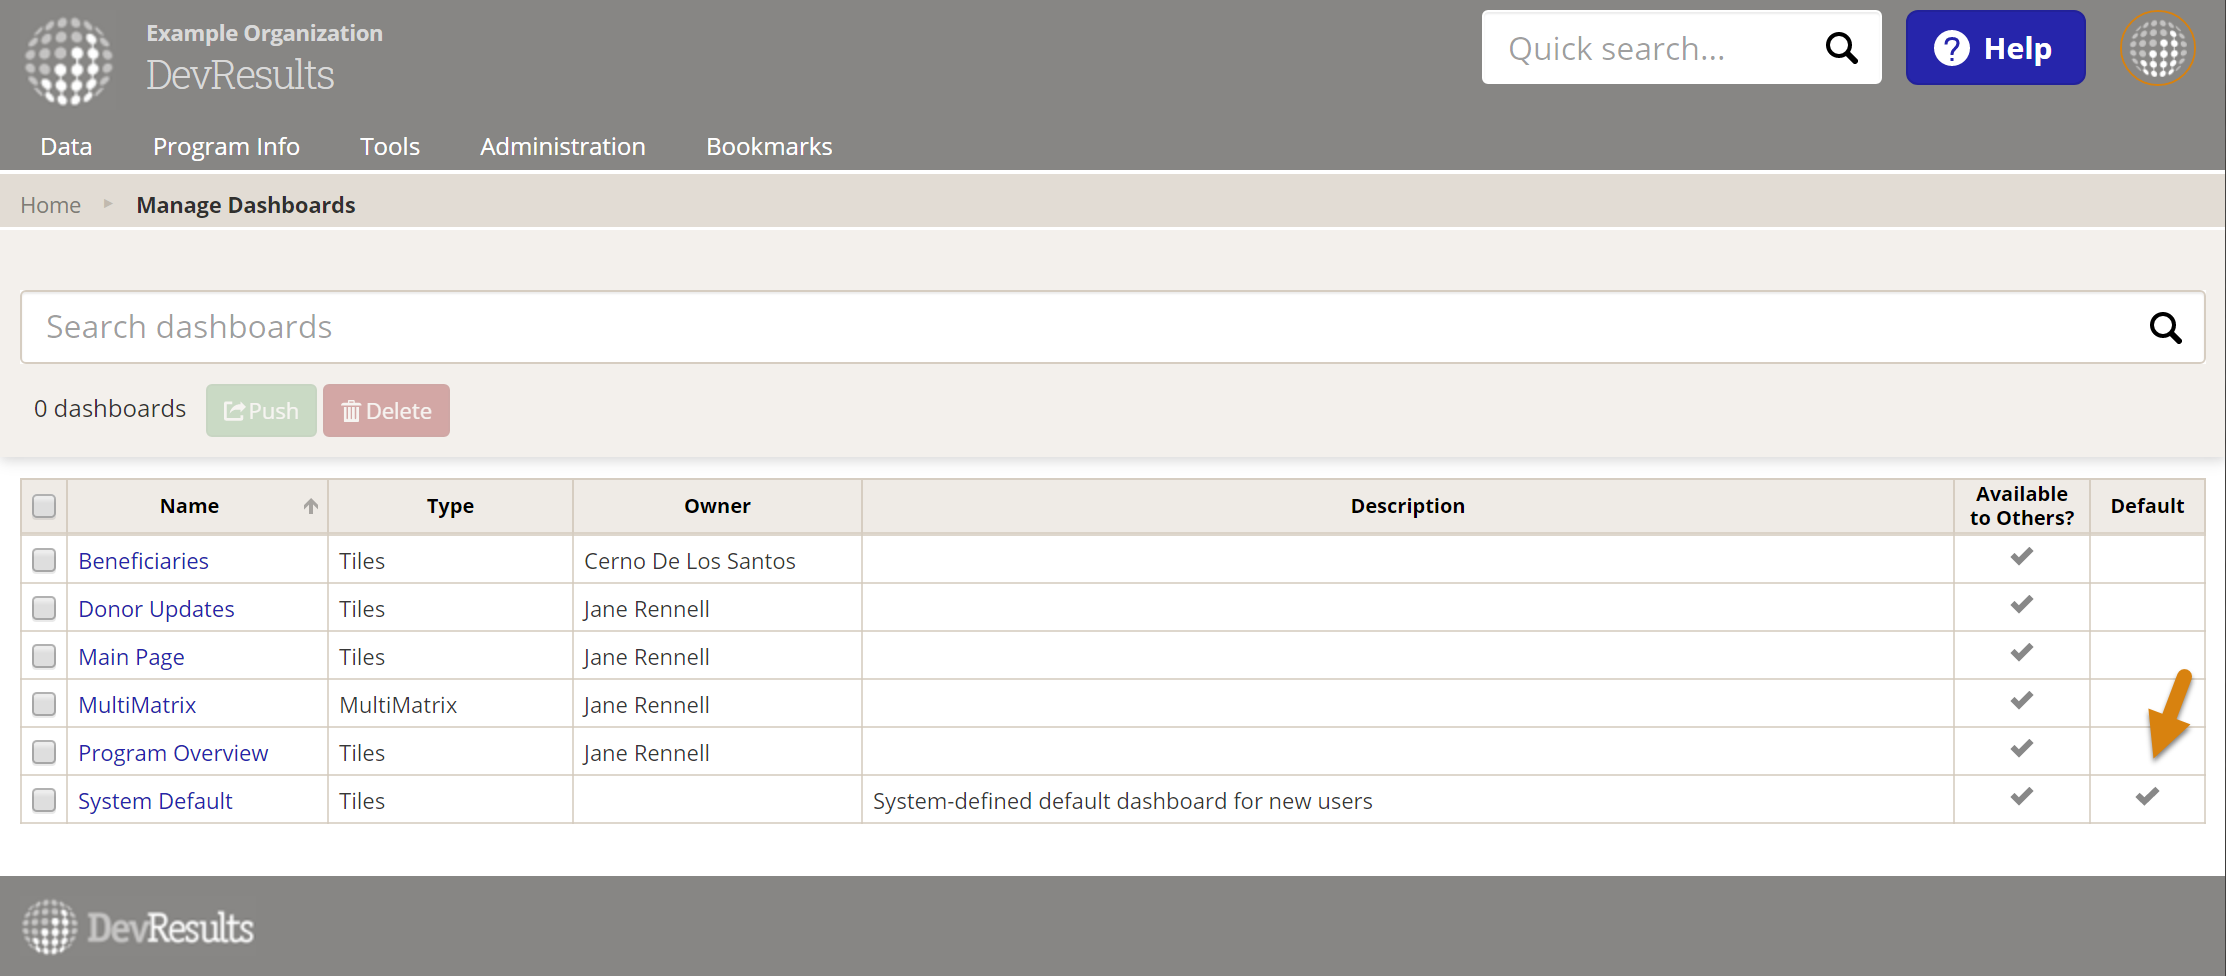
To change the default, click on the dashboard you'd like to make the new default. This will open the Configure Dashboard pop-up. In the pop-up, check the box next to Use as the default for new users. (This option is only available on dashboards you have created.) Then click Done.
Push a dashboard
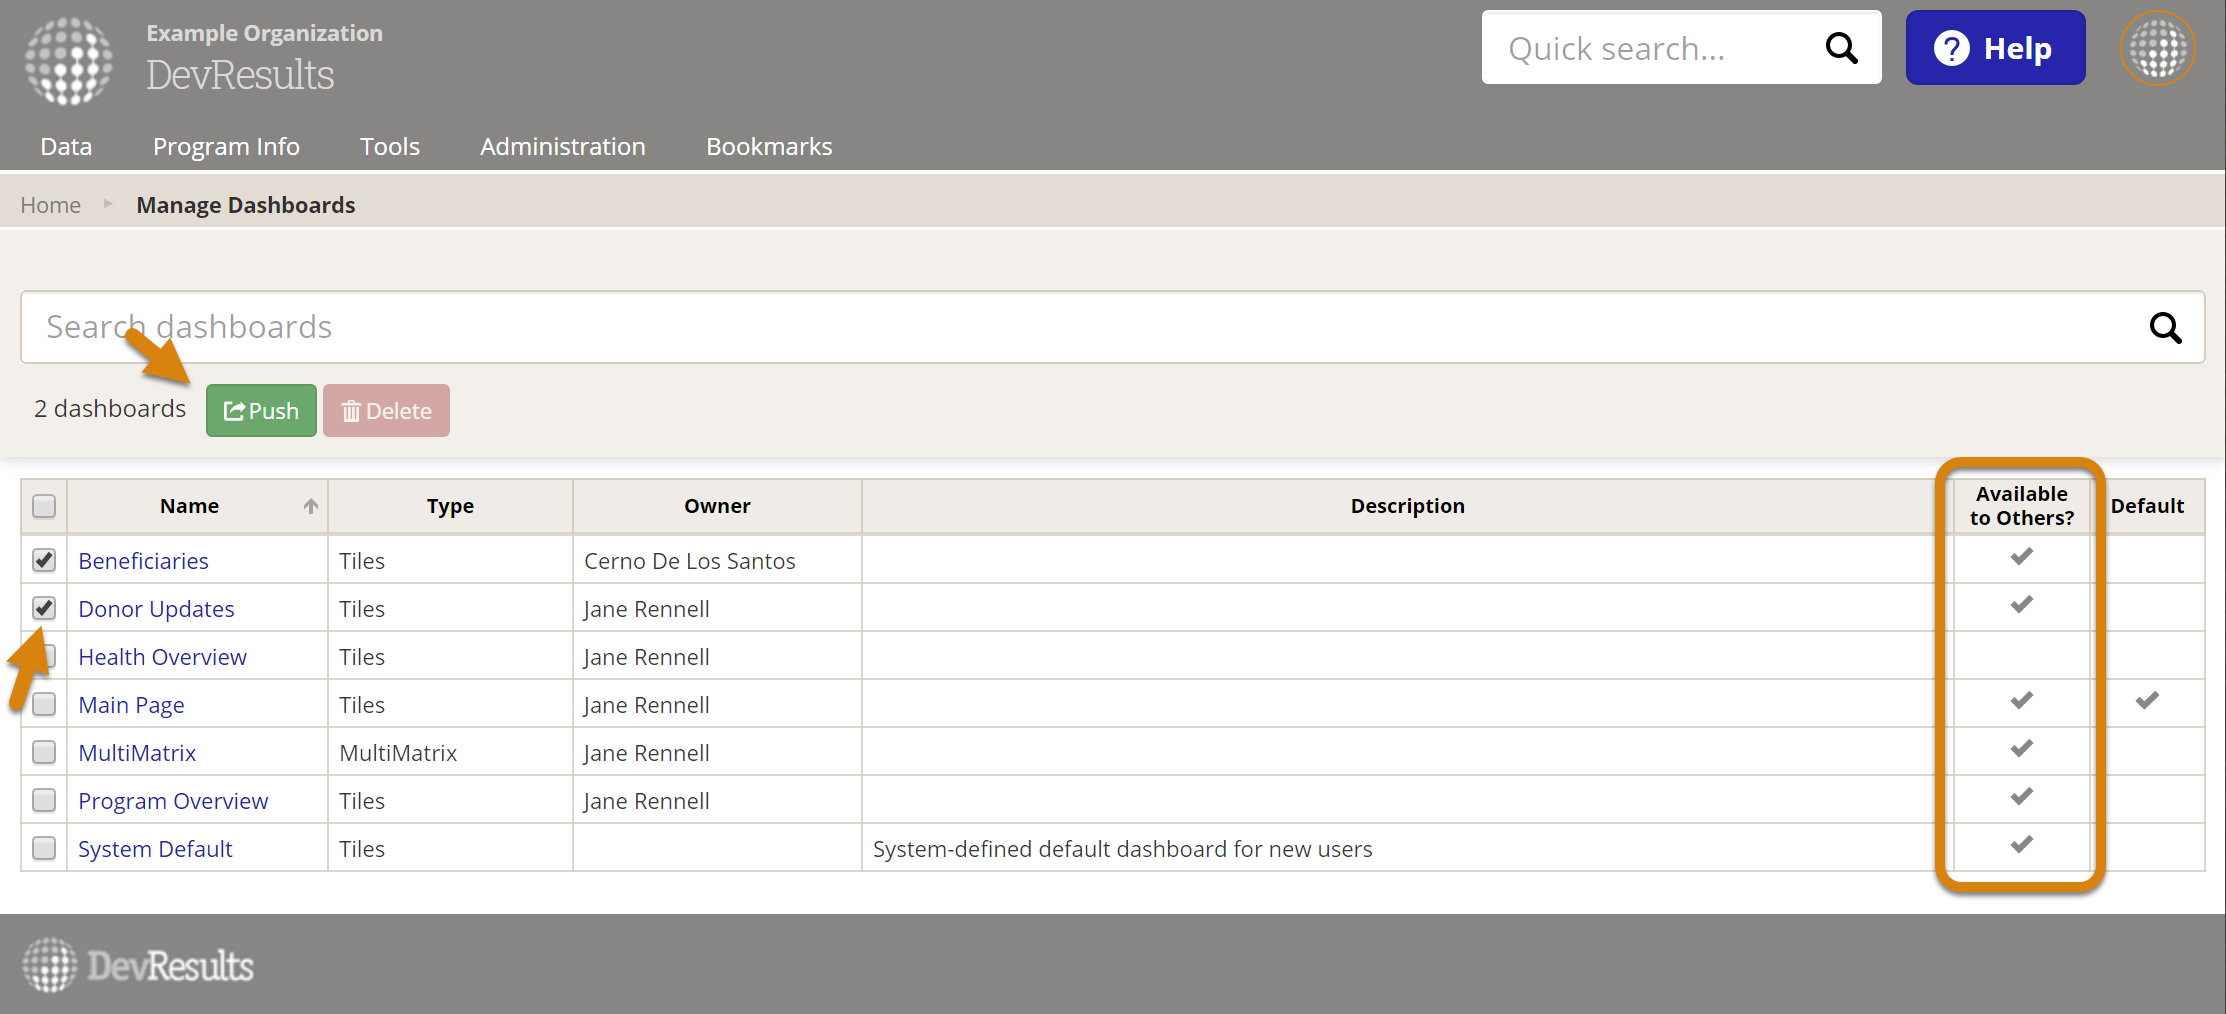
Users with the "Dashboard Manager" role can also push dashboards to other users. Pushing a dashboard to a user is the same as if the user added an existing dashboard to their own collection: it adds a view-only version, not an editable copy. To push a dashboard to other users, navigate to the Manage Dashboards page.

Select one or more shared dashboards and click the green Push button.
You can then select which users you would like to share this dashboard with, and elect to put this dashboard in front of the users other dashboards or not.
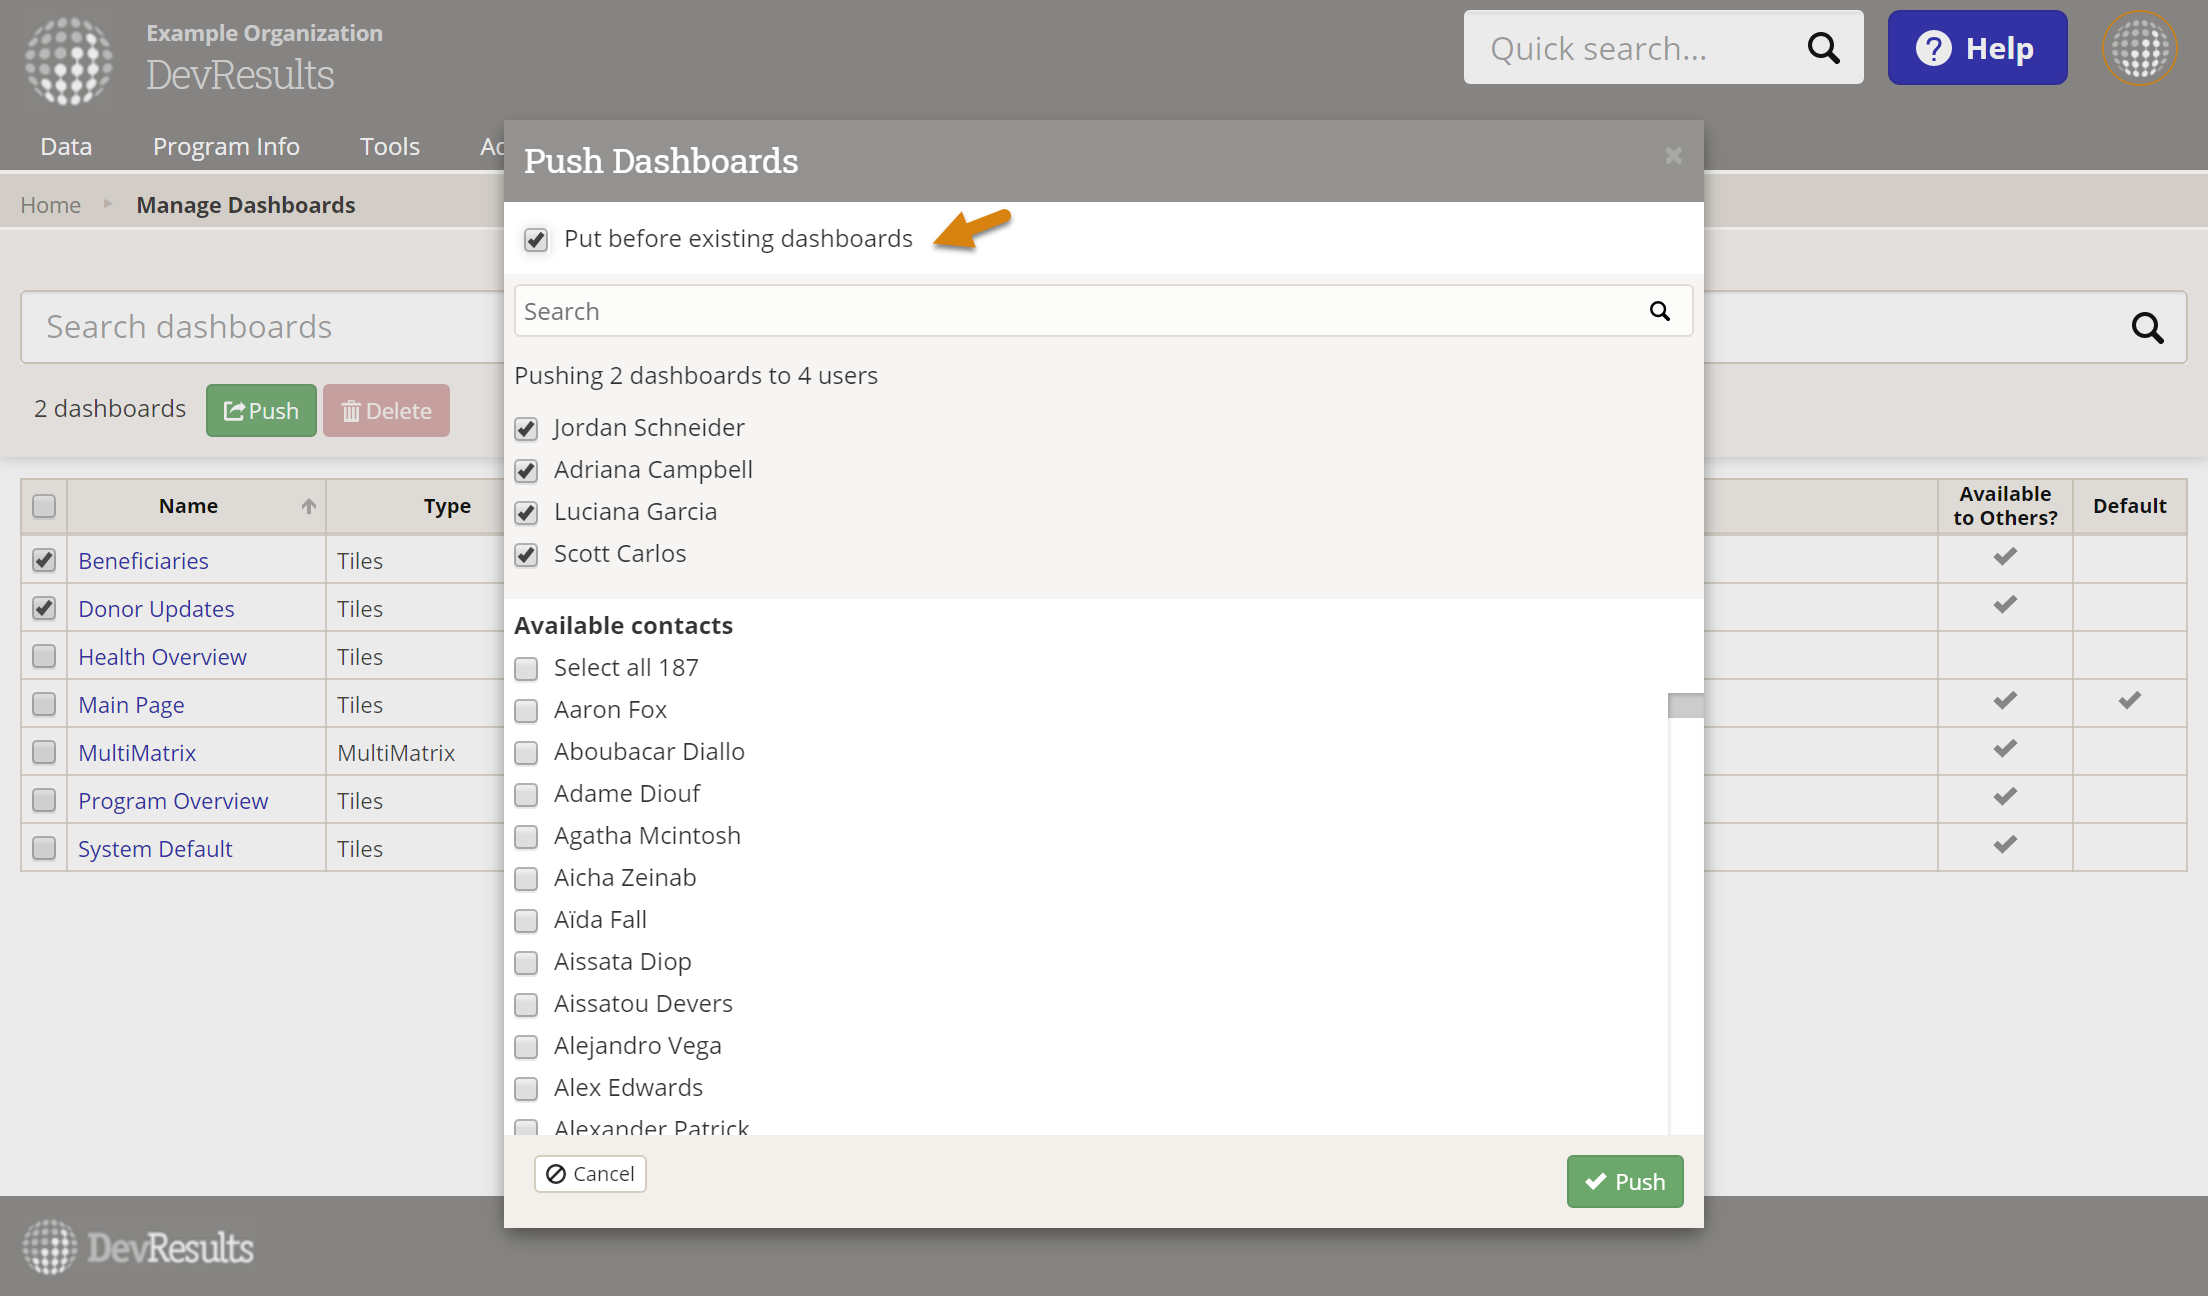
Click Push once you have completed selecting users.
NOTE: For tiles that can be filtered by project, the User Affiliation filter narrows results to only the projects that the report viewer is affiliated with. For example, if you filtered a tile to "User has bookmarked project" and then pushed it to another user, it would show information for the projects that were bookmarked by the new dashboard viewer, not the dashboard creator.

Change dashboard ownership
Users with the "Dashboard Manager" role can also transfer ownership of dashboards - shared or unshared - to themselves or to other users. This will allow abandoned dashboards or dashboards associated with former users to be managed, edited, and shared without having to make unnecessary copies. You can also transfer unnecessary dashboards to yourself and delete them.
From the Dashboards page, navigate to the Manage Dashboards page, select a set of dashboards, and click the "Change Owner" button.

Embed dashboard tiles
If you'd like to share one or more dashboard tiles with people outside of DevResults on your website, you can do so using an embed code. To embed a particular tile, click the gear icon on the top left corner of the tile. At the top of the configuration options, you'll see a blue Embed button which opens a pop-up window to change the name of the embedded tile, change the default size (width and height in pixels), and finally generate an embed code that can be used in any website or intranet application.

Note: Please verify that information in an embed is for public consumption before you create it. If you need to verify what embeds have been created, reach out to help@devresults.com and we'll set up a custom query for you.
Downloading dashboards
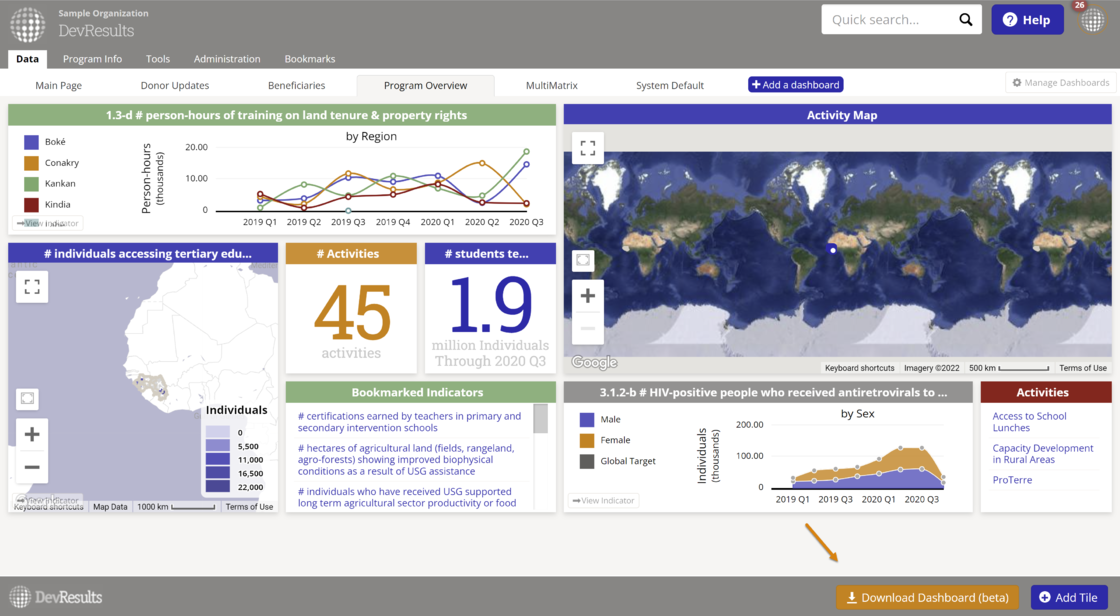
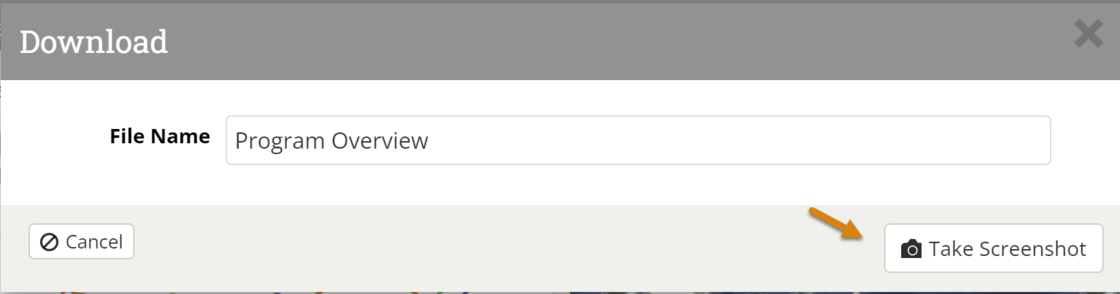
DevResults dashboards can be downloaded and saved as pictures for documents or reports.
Click on the orange Download Dashboard (beta) button, rename your image if needed, and click the Take Screenshot button.
You may need to resize tiles or move them slightly to get the optimal image or take a screenshot manually to make sure the dashboard looks exactly as it does on your screen.
NOTE: This feature is in beta. If you have any issues please contact us at help@devresults.com.
Didn't answer your question? Please email us at help@devresults.com.