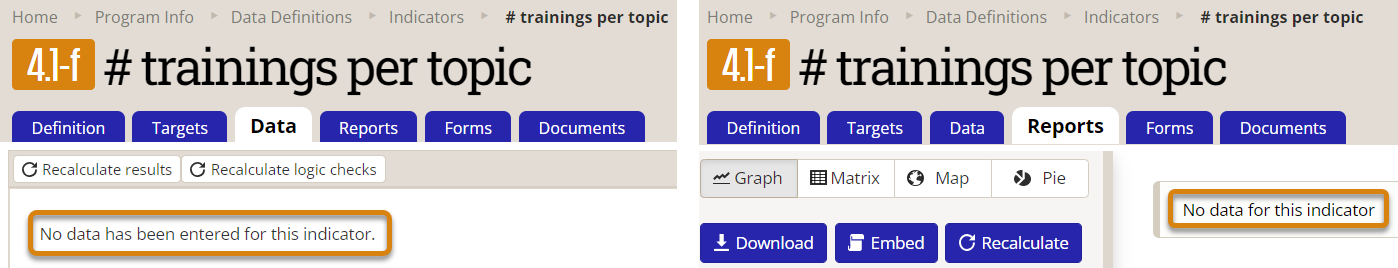
When setting up a new data table indicator, it's quite common to see "No data..." messages on the Data or Reports tab, even when the linked data table has many rows of data. Even if data appears, you may not see all of the data you expect.
This help article will walk through a series of checks to identify and correct this issue, in order from easiest to most involved.
Troubleshooting missing data
1. Recalculate results
Recalculating results will double-check for any data to display, and then reload the page.
Indicator results are calculated in a queue, and sometimes — especially for recently created or edited indicators — the last calculation simply hasn't had enough time to process the data when you go looking for it. By clicking "Recalculate results" (on the Data tab) or the blue "Recalculate" button (on the Reports tab), your calculation "jumps the queue" and is executed immediately.
You don't have to do this every time you look for results, but it never hurts to double-check.
If you still don't see data in your Data or Reports tabs, proceed to the next step.
2. Check indicator diagnostics
Before investigating the indicator definition itself, there are several indicator diagnostics (Tools > Diagnostics > Indicator tab) that can be helpful and time-saving.
Many of the diagnostics apply generally to all indicators (e.g. indicators not mapped to projects), but several are particular to data table indicators, namely:
- Indicators mapped to a data table without a project column
- Indicators that filter out all rows of the mapped data table
- Indicators that have results reported from a deleted data table
- Indicators with disaggregations missing from referenced data table
- Indicators with incomplete data table mappings
- Indicators with results data not relevant to project mappings (can also apply to formula indicators)
All of these diagnostics can be found quickly using the 'find' function in your browser (Ctrl-F on a PC or Command-F on a Mac) to search and highlight the text "data table." You should check each red diagnostic to see if the indicator in question appears, and if so, read the message that instructs you on how to resolve the issue.
Note: A red diagnostic does not necessarily mean that something is wrong. There are many valid reasons why, for instance, a data table has data for a project that is not being counted in a particular data table indicator (perhaps that project's data is tracked separately with a differently-defined indicator). Use your own judgement, and don't feel obligated to strive for "all green."
If you complete this step, recalculate results, and still don't see data in your Data or Reports tabs, proceed to the next step.
3. Check the indicator definition
Open up the indicator Definition tab and make sure that you have all the required elements of a data table indicator (which correspond to the 4 Ws — who, what, where, when — of the DevResults data structures):
- A selected geography column, which references a data table geography column of equal or lesser specificity?
- A selected date column, which references a data table date column?
- A logical set of filters (if using), which do not over-constrain or filter out all possible rows of data?
- A selected data table column for each included disaggregation (if using), which references a data table disaggregation column?
In most cases, you may only have one option for each column on the Definition tab; this makes the choice easy, but you still have to specify and confirm each column, in the event that you have multiple geography, data, or disaggregation columns of the same type.
If you complete this step, recalculate results, and still don't see data in your Data or Reports tabs, proceed to the next step.
4. Check the data table
If you're reasonably confident that your indicator definition is correct, it's time to check the data table. Because data tables vary widely, there is no one way or comprehensive checklist to go through, but common issues include:
- Leaving required fields "not set", null, or blank (e.g. project, geography, data, disaggregation), which will result in that row being ignored.
- Populating a data table project column, but not linking the indicator itself to specific projects.
- Not adding the appropriate reporting periods to the linked projects.
Note: Projects must be both (1) linked to the data table indicator and (2) selected in a project column in the data table itself. Geographies, on the other hand, need only be referenced in a geography column in the data table — you do not have to also link the same geographies to the project (though it is a good practice). This slight difference is due to the fact that project linkages confer reporting duties and data table permissions for partners, whereas geographies do not (and can be numerous).
If you complete this step, recalculate results, and still don't see data in your Data or Reports tabs, you may wish to create a Helpdesk ticket to find out what's wrong.
Troubleshooting incorrect or incomplete data
Sometimes a data table indicator may have some data, but the result is much higher or lower than expected. This can usually be traced to similar issues as above (especially an unfinished calculation or incomplete rows), but often without the aid of diagnostics or obvious indicator definition issues. Even so, there are a few other common culprits.
The best way to inspect for these issues is to export the entire data table to Excel.
Check for filter combinations
An easy way to see what a data table indicator 'sees' is to use Excel's filter functions to apply the same set of filters. If you have applied multiple filters to your indicator, add a filter to your header row and apply the same filters in Excel.

With those filters applied, try to reproduce the rest of the calculation — sum, average, or count — as best you can, and compare to the results in DevResults. If they match but are still unexpectedly low or high, your indicator definition may need to be adjusted.
Check for unique rows
Count unique indicators can be frustrating because counting unique observations across multiple dimensions — projects, reporting periods, geographies, etc. — can be tedious and unintuitive to the human mind. Even so, Excel can help.
The fewer items in your count unique set, the easier it will be to replicate that logic in Excel. If a single column — such as a unique ID — is doing the bulk of the deduplicating of results, you can highlight duplicate values in Excel by using conditional formatting with just a few clicks.

For multiple columns that jointly determine which values are duplicates or repeats, you may have to play around with a combination of conditional formatting, filtering, and sorting to help you 'see' what DevResults sees when it calculates a unique set.
As always, the DevResults Data Team is standing by to help you troubleshoot a particular challenge — just create a Helpdesk ticket and tell us what result your getting and what result you're expecting.
Didn't answer your question? Please email us at help@devresults.com.